Data View and Format
Table of contents
Grid vs Plain Text Views
You can switch between two data presentations in SE version and four presentations in EE version. Pressing CTRL+~ switches available presentations in turn.
- To see the data in a grid view, similar to an Excel spreadsheet, click the Grid button (
 ) on the bottom toolbar of the editor.
 - To switch to the plain text view, click Text (
 ) on the bottom toolbar.
 - To switch to JSON view (available in EE version only for MongoDB documents and JSON tables), click JSON on the toolbar.
To switch to XML view (available in EE version only for XML tables), click XML on the toolbar.
Table vs Record Views
The table view is a standard table (Excel-like) in which columns are vertical and rows are horizontal. This view is the default one. If you click the Record button in the bottom toolbar of the editor (![]() ), or press Tab, or right-click a cell and then click Layout -> Record on the context menu, the rows and columns switch positions. The columns will appear as rows, and the rows will be hidden in one Value column which will show only one row of data. The column headers will shift from the top of the table to its left side:
), or press Tab, or right-click a cell and then click Layout -> Record on the context menu, the rows and columns switch positions. The columns will appear as rows, and the rows will be hidden in one Value column which will show only one row of data. The column headers will shift from the top of the table to its left side:
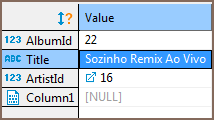
The Record view is useful if the table contains a big number of columns. To navigate from row to row of data, use the navigation buttons on the bottom toolbar of the editor: ![]()
To return back to the standard table view, click the Record button again.
Rows Coloring
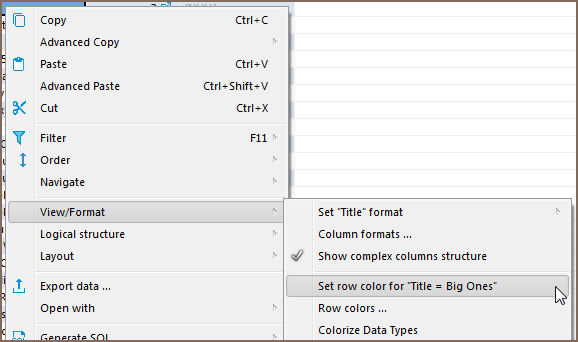
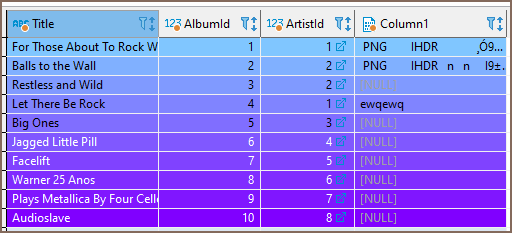
In the data editor, you can color all rows that have the same value as a particular cell of a certain column. To do so, right-click the cell and click View/Format ⇒ Set the row color for {column name = value} on the context menu:
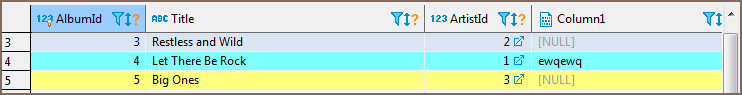
Then choose the color in the palette window that appears and click OK. The current row and all other rows that contain the same value change their color to the one you have selected:
To remove the coloring by a particular column, right-click the cell again and click View/Format ⇒ Clear color for {column name = value} on the context menu.
By choosing View/Format ⇒ Row colors ... from the context menu, you can gain more precise control of coloring conditions:
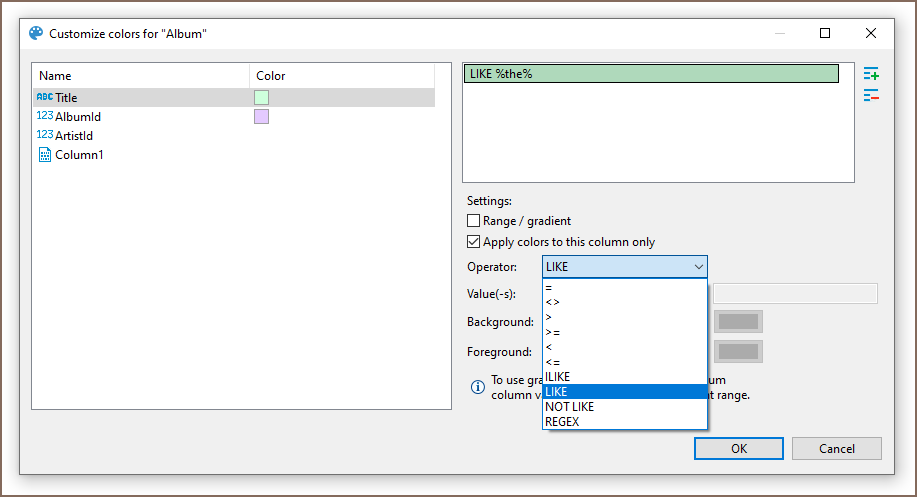
Here, you can define multiple conditions for single column using rich set of predefined operators, change background color and define a range between two values.
Operators work as you may expect. Note that they're executed on the client-side, that means no extra queries are made in order to apply colors.
Value range and gradient
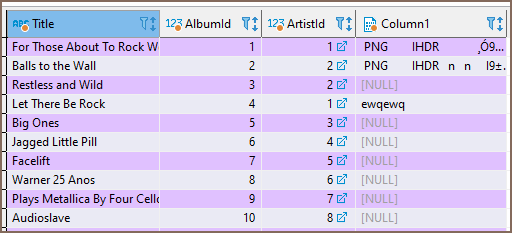
Value range allows you to paint your rows with gradient that fades from first value to second value:
In this example we defined a range for column AlbumId that fades from #80c6ff to #8000ff between values 1 and 10.
Using regex
You can use regular expressions for matching complex values. Otherwise, you can be artistic and, for example, paint rows with odd values in your favorite color:
Snippet for coloring odd rows: ^\d*[13579]$; even rows: ^\d*[02468]$
Coloring by Data Types
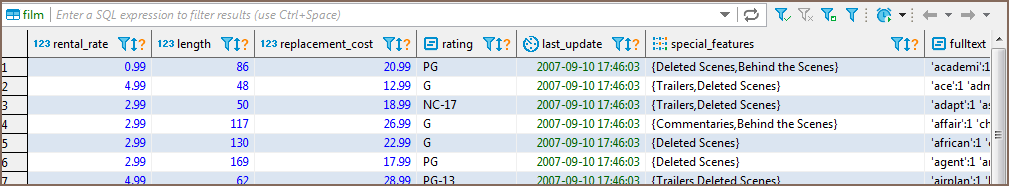
Besides coloring rows by a value, you can color the values in the columns by data types. To do so, right-click any cell in the table and, on the context menu, click View/Format -> Colorize Data Types. The values in the cells will be colored in different Colors according to the current color preferences:
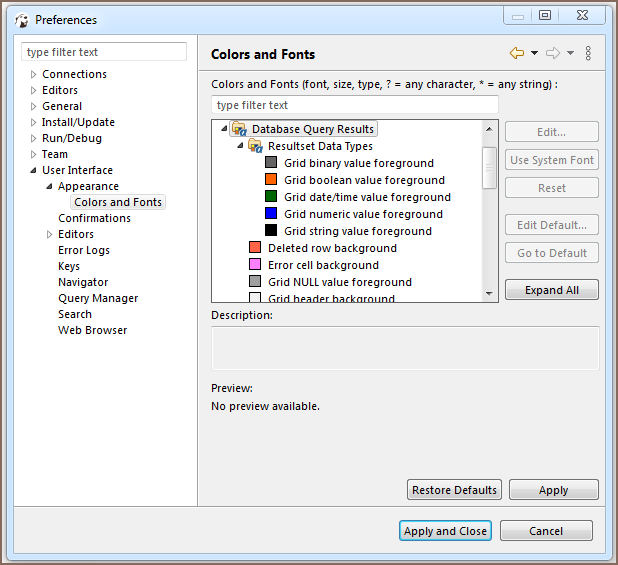
You can change the color preferences in the Preferences window by: clicking Window -> Preferences on the main menu. In the window of the navigation pane on the left, expand User Interface and then Appearance, and then click Colors and Fonts:
To remove the coloring by data types, on the context menu, click View/Format -> Colorize Data Types again.
Transforming Data Presentation
For string and numeric data types, DBeaver provides tools to transform the data presentation into a number of formats, such as URL and Binary for strings and Epoch Time, Number Radix, etc. for numbers. To change the data presentation in a certain column, right-click a cell in the column. Then, on the context menu, click View/Format -> Set {column name} format and click the presentation type name:
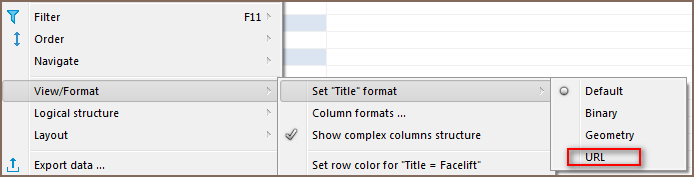
The Transformer settings window opens showing the value in the chosen format. Click OK to apply the change:
![]()
The values in the column appear in the new format.
NOTE: For URL format, the resulting cell provides a link to the URL in a browser window.
To roll back the changes to the default format, right-click any cell in the column, and on the context menu, click View/Format -> View as -> Default.
Structuring Complex Data Types
For complex data types (that themselves represent a structure), such as objects, structures and arrays, DBeaver provides a tool for breaking them into columns:
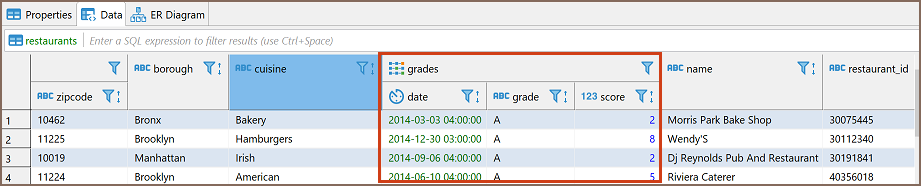
To do so, right-click a cell in the column and, on the context menu, click View/Format -> Visualize complex columns.
Configuring Numeric and Time Data Formats
You can specify the exact format of Time, Timestamp, Date, and Number data used in the currently open database or globally. To specify a format, right-click any cell in the table and, on the context menu, click View/Format -> Data formats. The Properties window opens displaying the Data Formats page:
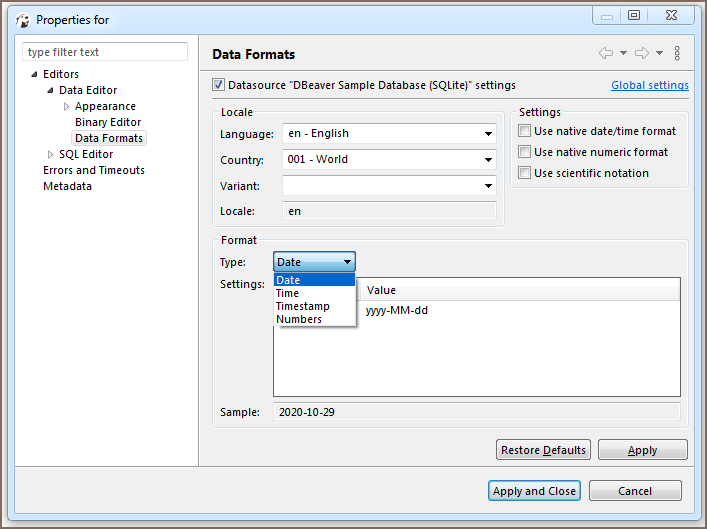
To configure only the format for the current database, select the Datasource "[Connection name]" settings checkbox. To configure the settings globally, to all databases that you have in DBeaver, click Global settings.
You can specify the locale for the data format in the Locale area. In the Type dropdown list, click the name of the data type and in the Settings table, click the required format.
To apply the changes and make them visible in the table, click Apply and Close and then refresh the window (F5).
Configuring Boolean presentation
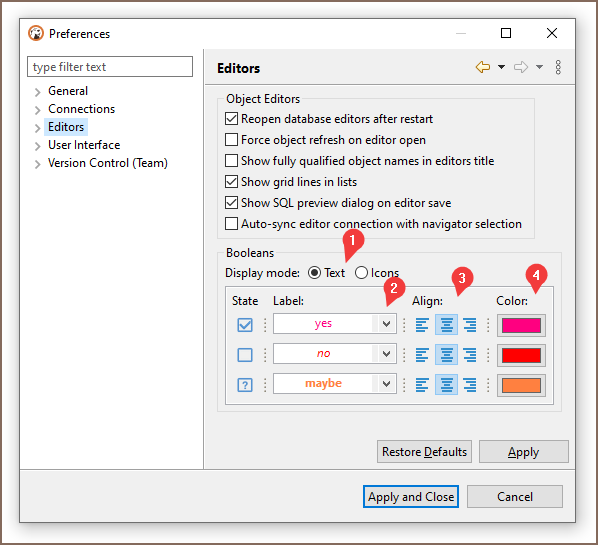
You can choose between two presentation modes1:
- Text-based
- Icon-based
Text-based presentation
This is the most customizable mode. You can:
- Change labels under Label column.
Otherwise, you can use presets available in Drop-down Menu2 - Change alignment of value inside grid cell.3
Following variants are available: left, center, and right - Change color of value using color picker under Color column4.
You can reset color to match current theme's contrast color in Drop-down Menu2 ⇒ Colors ⇒ Use theme default color - Change font style in Drop-down Menu2 ⇒ Styles.
Following variants are available: normal, bold, and italic
Icon-based presentation
This presentation only supports alignment changing.