Let’s take a look at a small company that manufactures and sells merch all over the world using its own online shop. The boss asked his assistant Louis to reward regular customers by sending them gifts. To get a list of the mailing addresses, he needs to select the desired group of customers.
How can he do all of this with DBeaver?

An easy start to analytics
Louis decided to choose the customers who made the most expensive one-time purchases and spent the most money on orders in total. To get a list of addresses for sending gifts, he needs to:
- Select customers with the amount of one purchase above the average.
- Find the sum of payments for each billing address.
- Choose customers who spent the most money on purchases in total.
- Export the results in a file format to add them to the report.
To get started, Louis needs to open the table with the purchase data for the last quarter, go to the Calculation Panel and select the column with the payment amounts.
The Calculation Panel is very fast and allows you to work with data in real-time as it does not create any additional queries to get data from the database.
Therefore, if you need to process all the rows from the table, you will first have to change the fetch size.
By default, the Calculation Panel displays the count of selected rows, but Louis also can choose one of the available functions for his column. In this case, he applies the AVG function.
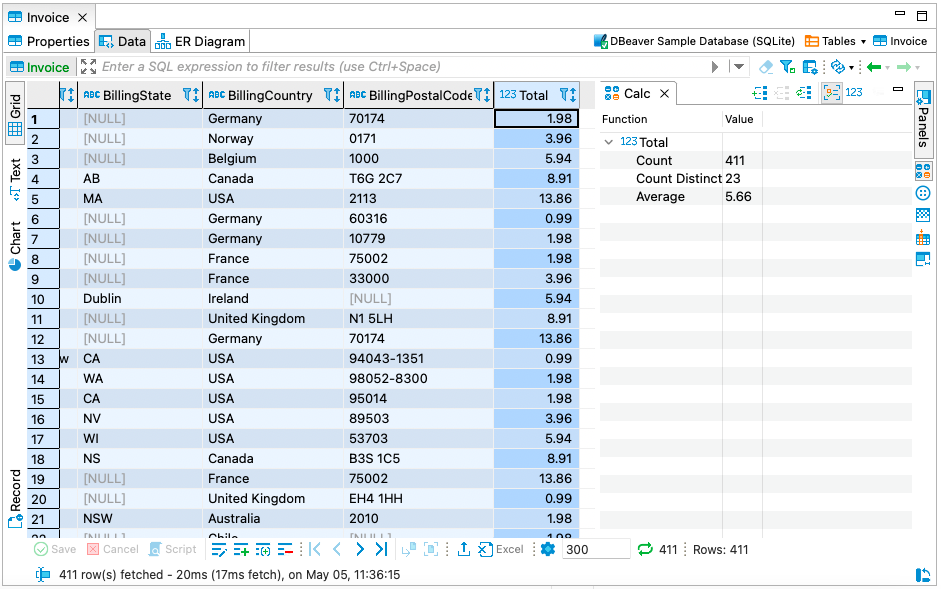
For online stores with free shipping, it makes sense to motivate customers to make one-time orders for larger amounts. Now Louis knows that the average purchase is 5.66, and he can use this information to generate a report.
You can apply the functions of the calculation panel not only for numerical data but also for string data.
To switch between modes, click on the toggle with numbers. In this case, sorting will be done alphabetically.
Creating a report
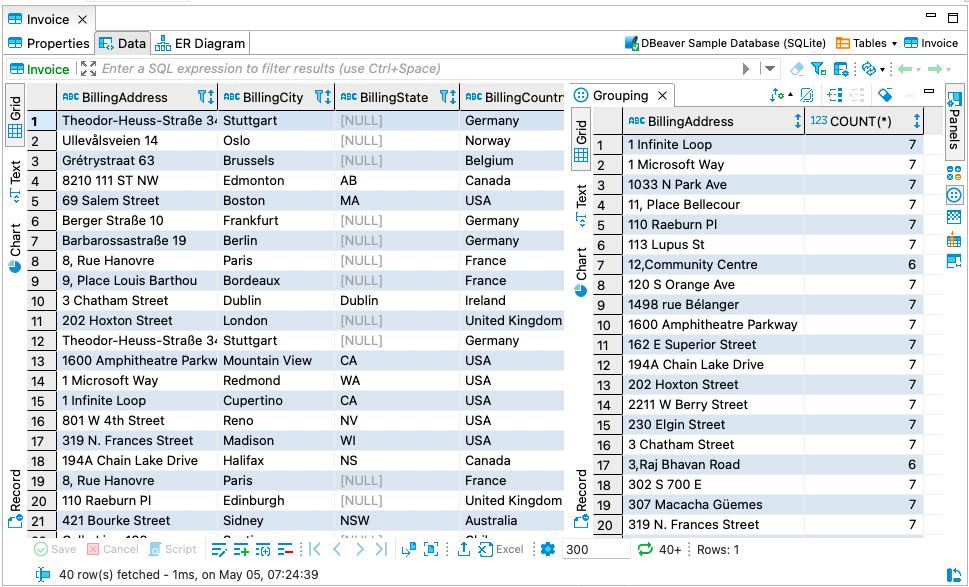
To create a report, Louis will use the Grouping Panel. It automatically groups data from the selected column by value and indicates the number of these values.
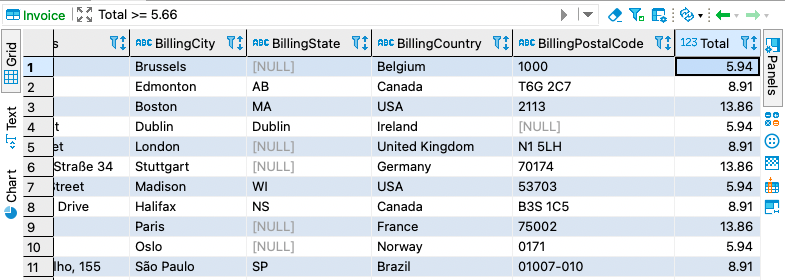
To leave only purchases above the average in the table, our hero needs to apply the filter Total >= 5.66.
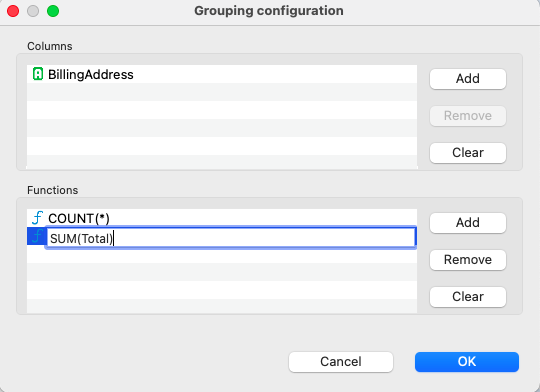
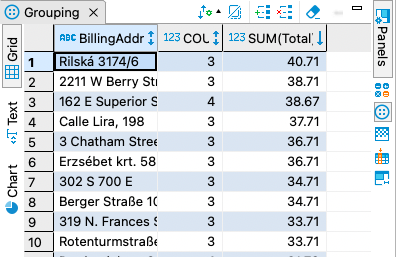
Then he opens the Grouping Panel and drag and drop the BillingAddress column into it. In the second column, you can see the number of purchases for each address.
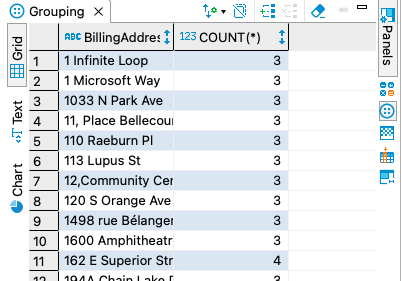
Here Louis can use a variety of custom functions. In his case, he adds a SUM function to calculate the final payment amount for each customer.
Now Louis can define the top spenders of all the products. To do this he needs to sort the data in descending order. This can be done by clicking on the arrow in the column heading or changing the default sort in the top toolbar.
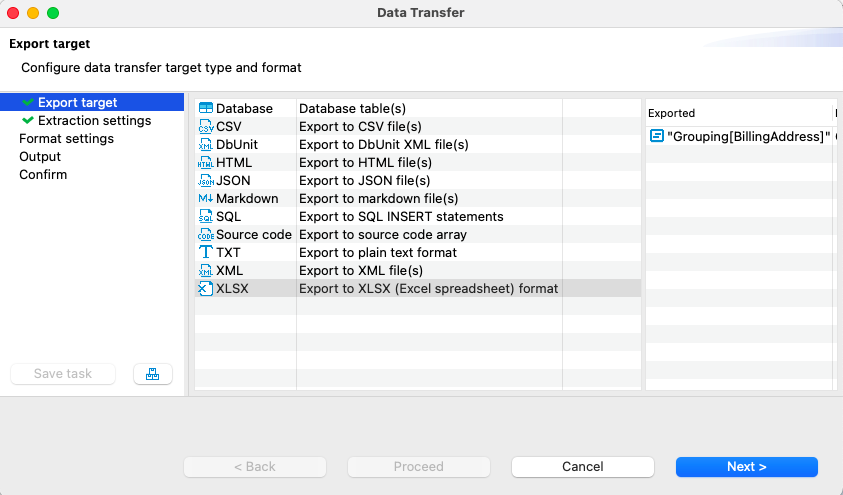
Once the result set is ready, the boss’s assistant can save it and add it to the report by going to the right-click context menu and choosing Export data. Then he can select the file format and apply appropriate settings. For example, if he wants to export into Excel, he can limit the number of rows in a file, change row font, border style, etc.
To collect statistics, Louis can visualize the result set using the Chart tab. With the context menu, he can save, print or copy the chart to the clipboard.
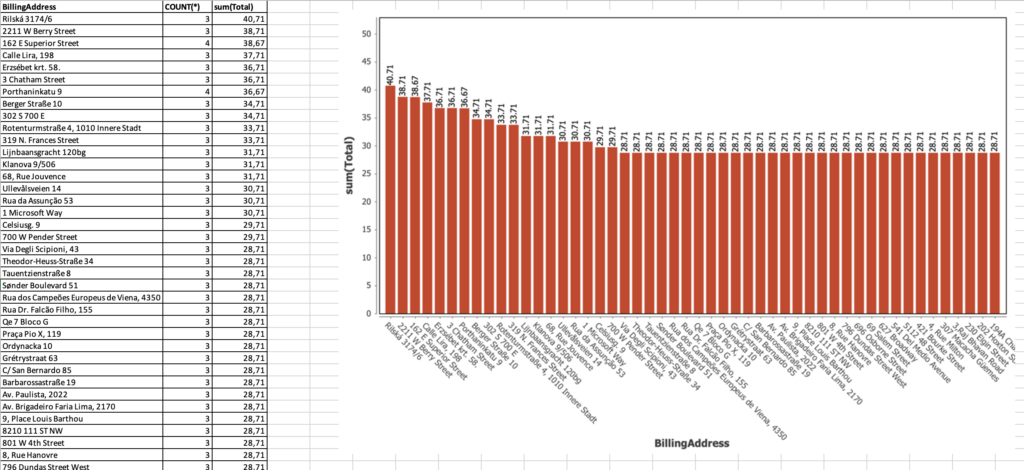
To change the selection of columns used to build the chart, go to the context menu -> Settings.
Now, after saving all the results, Louis can click on the Eraser button in the top toolbar to clear the grouping panel and move on to creating another report.
Well done, Louis! Nice job!
Read more about the Calculation Panel and the Grouping Panel on our Wiki