Query Execution Plan
Table of contents
Execution Plan
Simple plan view
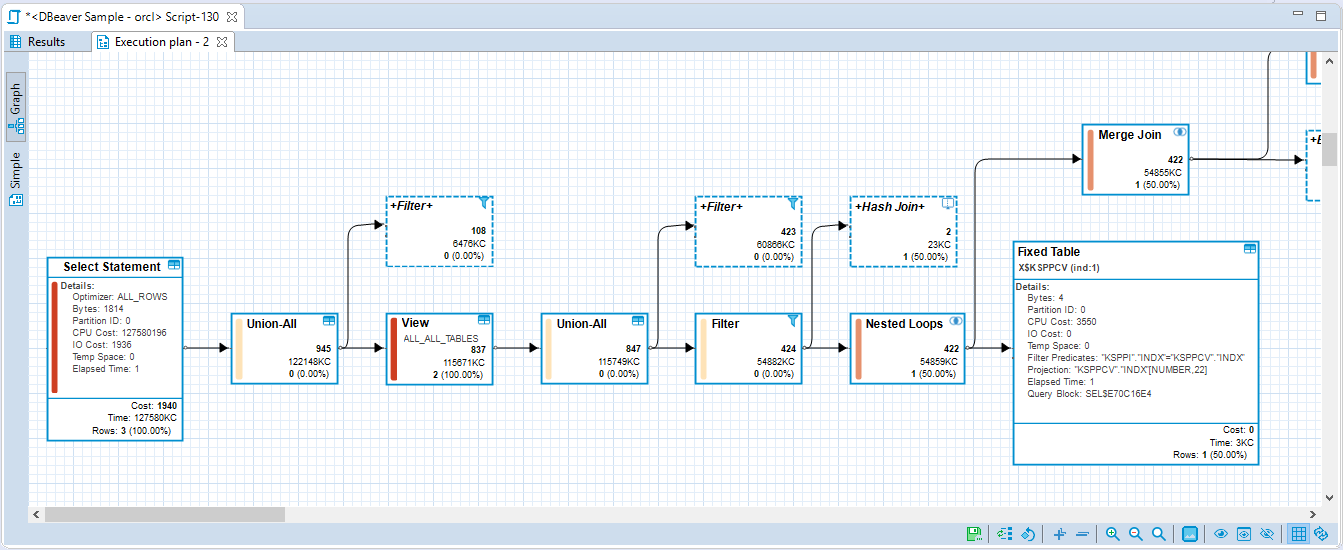
If a database driver supports execution plan visualization, you can see the execution plan of the current query (under cursor) by pressing Ctrl+Shift+E or clicking Explain execution plan on the context menu or in the main toolbar: ![]() The execution plan command generates a tree of query execution as one of the result tabs and is convenient in estimating if the query/script is quick/optimal enough:
The execution plan command generates a tree of query execution as one of the result tabs and is convenient in estimating if the query/script is quick/optimal enough:
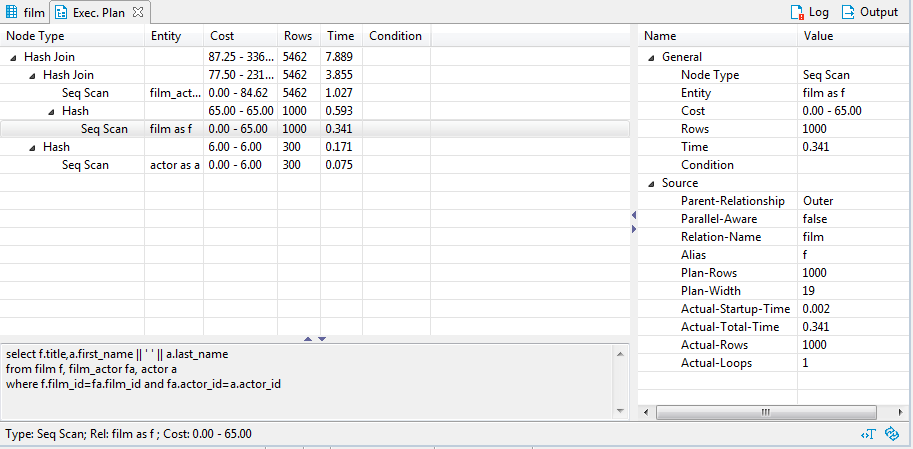
You can click the rows of the execution plan to see their details (statistics) in the panels below and to the right of the plan.
To reevaluate the plan, click the Reevaluate button (![]() ).
To see the source script on which the plan is based, click the View Source button (
).
To see the source script on which the plan is based, click the View Source button (![]() ).
).
Advanced plan view 
In DBeaver Enterprise Edition you can use advanced (graph) execution plan visualization.
This visualization shows most expensive (cost-based) plan nodes. You can hide all irrelevant nodes, see node details, use horizontal or vertical pln layout, export it to image or save as json to pass plan information to a colleague.