Ten years ago, we could not even imagine the words “database” and “financial analyst” in one sentence. The database world existed only for stern developers and administrators who wrote complicated scripts in a console window.
But now a large number of financial companies are constantly using DBeaver. The implementation of our products for analysts’ workflow is always accompanied by a lot of questions and concerns. We collect the top 5 popular questions and solutions for this article.
We have to make it secure
In our bank, all employees sign in to the internal systems with a login, password, and security code on their phones. All data is encrypted and saved in closed storage, with only security engineers having access to the system’s settings. How is it possible for an analyst to connect to the database in such an environment and not break the rules?
All DBeaver Pro versions support modern security standards for database connectivity. All strange abbreviations like SSO (including Okta), SAML, MFA, Kerberos, SSL, SSH, and their combinations are also supported.
Database administrators can set all security settings in a special configuration file and install DBeaver on the end-user machine. It is a win-win situation for both sides: administrators do not need to share restricted information and analysts do not need to perform a complicated connection setup. All they need is just to run DBeaver and start working.
We are dealing with bulky databases
We have hundreds of thousands of tables in our database, and it is almost impossible to manually find the necessary one among them. How can I speed up and simplify this process, and won’t using a database manager overload my computer’s operating system?
DBeaver does a great job when it comes to a large number of tables. The size of a given database will not affect the speed or efficiency of a financial analyst’s work with it. DBeaver allows users to easily filter data and display only what they need for a particular task.
Moreover, DBeaver’s navigation tree has a simple view mode, which provides a clear interface for connections. When this mode is turned on, only tables and views are displayed in the tree, and all additional meta-information is hidden. Thanks to this, working with the database becomes more intuitive.
We do not want to retrain
We are accustomed to using Excel for our work. Is it possible to avoid long retraining and keep working the same as before?
Financial specialists can use DBeaver as a much more advanced alternative to Excel. It has a user-friendly interface that makes it easy to work with large amounts of data. Analysts can highlight data cells or specific data types and use the Grouping panel to calculate statistics based on a table of a custom SQL query. Using this panel, it is possible to group bank customers by age, region of residence, or other characteristics, and use the data obtained to analyze their solvency.
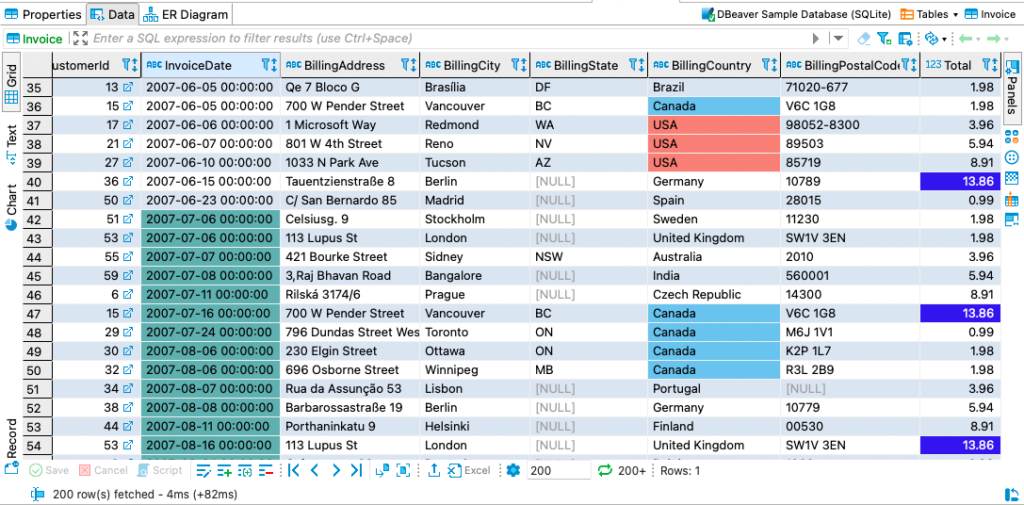
Also in DBeaver, there is a Calc panel which is useful for getting basic statistics across data in several columns and rows. When the user selects the rows and columns he needs, this panel updates dynamically to show statistics for the selected data. For example, analysts can select a column with customer debts on loans in a table and find the average and maximum values in a few clicks. Thus, DBeaver saves financial analysts from complex and monotonous manual work.
We need to generate reports based on data from multiple tables
Financial analysts in our company are used to working in office applications, and they are not professionals in SQL scripting. Is it possible to simplify the process of creating queries and generating reports based on them?
DBeaver allows users to easily work with SQL queries and visualize data in different ways. Using Visual Query Builder analysts can bring data from different tables together, group, filter, and sort data, get a result set and generate summary reports. This tool will be helpful for specialists who want to create a report based on data from several tables filtered by a specific date-time.
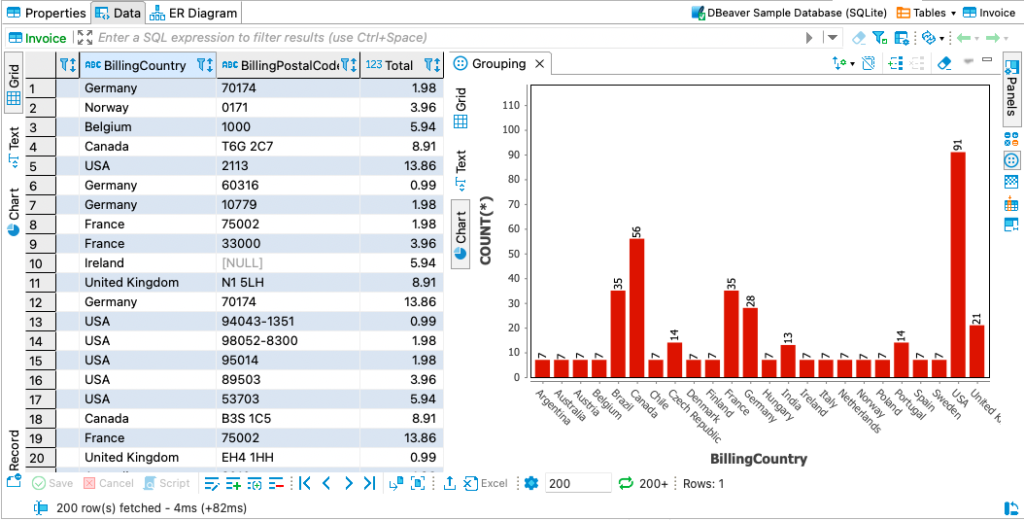
With the help of the Grouping panel, it is possible to create colorized bar charts for quick data visualization and create simple reports. For example, this feature can be used to determine how customers or clients are distributed across cities in a country.
We want to export results without double the work
After finishing work on a report, I would like to be able to export it into a convenient format. Can I do this without having to further edit the file?
DBeaver supports different export formats, including excel datasheets, which are used by most financial specialists. They can do all the data preparation in a convenient and intuitive way using our app. By adding only the necessary data to the report, DBeaver users can eliminate the need to further edit files.
In addition, our app allows you to send a report by email. You can specify several recipients and the subject for your mail.
That’s not all
Today we talked about solutions to the 5 most common issues that financial specialists face when working with databases. But of course, that is not all that analysts can do with DBeaver. For example, more advanced users can automatically create reports, compare them and share the results with colleagues using our app. We will definitely cover these topics in the following articles.