Are you looking to get a better grasp of your database structure? Entity Relationship Diagrams (ERD) in CloudBeaver are a powerful tool for visualizing the relationships between different database objects. We dive into the functionality and benefits of ERDs in this detailed article. Whether you are a seasoned database professional or new to SQL scripting, ERDs offer an intuitive way to navigate through a complex database structure and check it for links between tables.

We are back with our database management expert, Louis, and his fellow marketers, who continue to explore the capabilities of CloudBeaver. Today, they will have to combine the contact details of New Year’s Eve action participants with information about loyal customers. They must aggregate the data into a single result set to do this.
First, they should log into their CloudBeaver Enterprise account, where they will work with a schema that contains their customer contacts and product data for their company. This is where the new holiday_action table with information about their customers who participated in the last promotion and their customers’ table with all clients’ data, is located.
Once they have validated the data, they can start writing the query for the aggregate information via SQL Editor. The marketers only need to select the required columns from the two tables via SELECT and then join the same rows using the INNER JOIN keyword.
We have already learned how to compose and execute queries in CloudBeaver
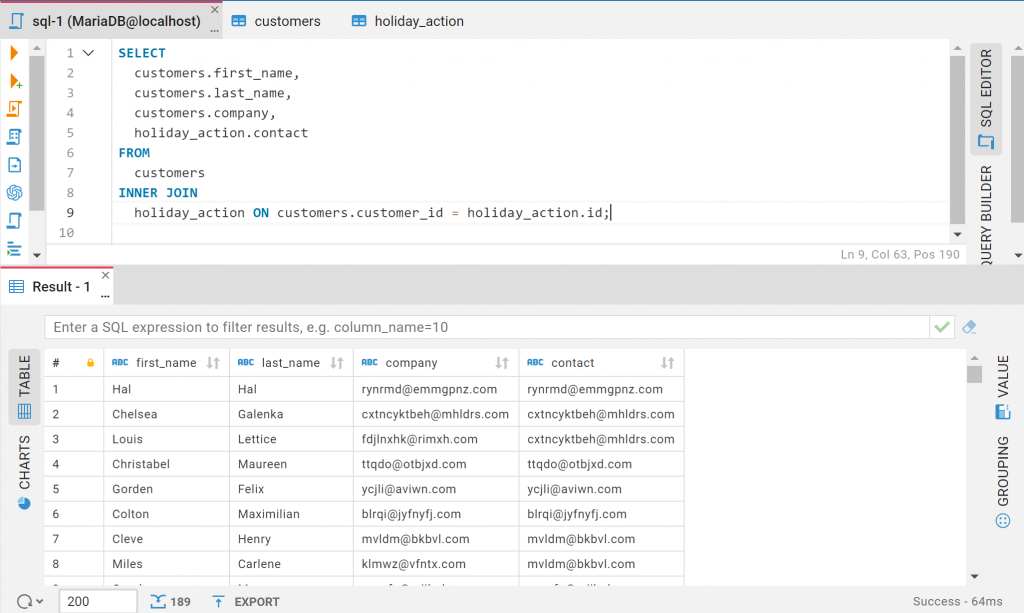
Now, the marketers can see 189 rows in the result set. They decide to check how many rows are in holiday_action to make sure that all the data in it is synchronized with the customers. When it is opened, the table has twice as many rows as the result of the above query. This means that not all the data from the New Year’s Eve campaign participants has made it into the table.
This has happened because the new ones also attended the campaign along with loyal customers. The marketers want only their regular clients to be included in the holiday_action in the future, as this is their target audience.
What should they do about this? Louis knows the answer: he suggests checking the relations between the two tables in ER Diagrams.
If the table with the New Year’s Eve participants has the foreign key from the customers, then only the data of the existing row in the second one will appear in the holiday_action.
A primary key is a unique identifier for each record in a database table. A foreign key is a column or a set of columns in one database table that refers to the primary key in another table.
To do this, they select the Diagram tab with ERD when opening the schema.
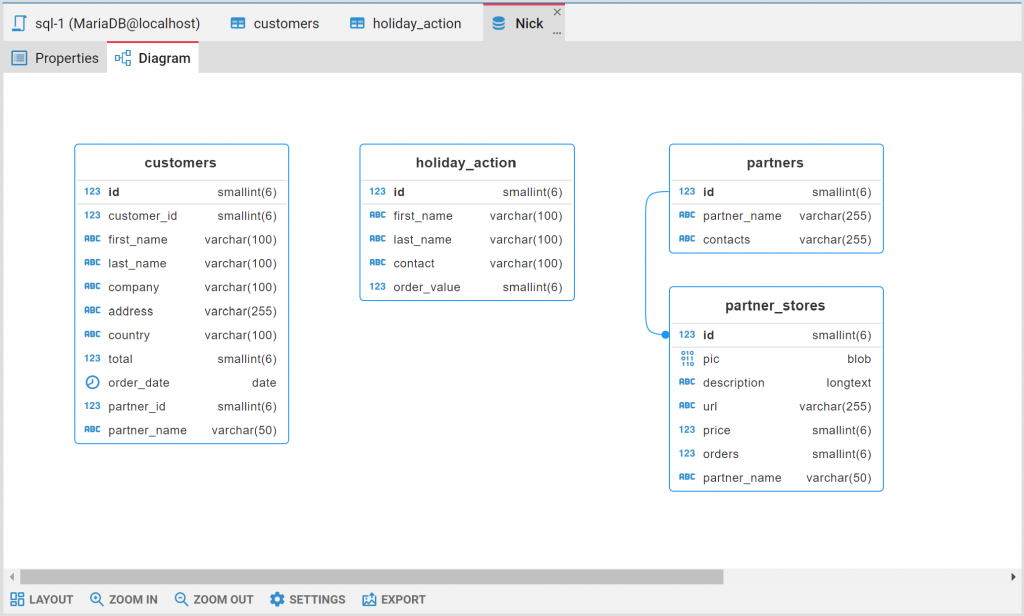
The heroes see that there is currently no connection between the tables. However, this can easily be solved using a query with an ALTER TABLE statement in the SQL Editor. The same query has the ADD Constraint keyword, denoting which column heroes want to give the foreign key to and which column it references in the customers table in the specified schema. This basically means that the constraint links the columns in different objects, which ensures that each ‘id’ matches an existing ‘customer_id’ in the other.
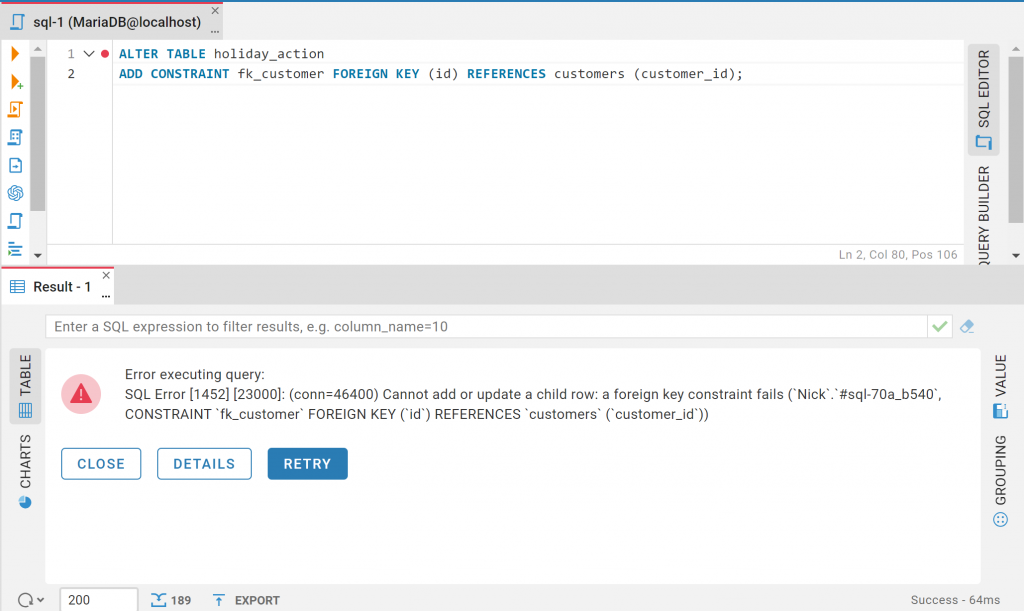
As they understand from the error in the tab, it will not be possible to establish a link with the data that does not match the customers’ values. So the marketers ask their company’s database administrator to remove rows with non-permanent customers from the holiday_action.
After the colleague has fulfilled their request, they execute the query again, but with success.
They must click the Refresh button in the top menu of the Database Navigator. The marketers then go to the schema with the desired tables and open the Diagram tab.
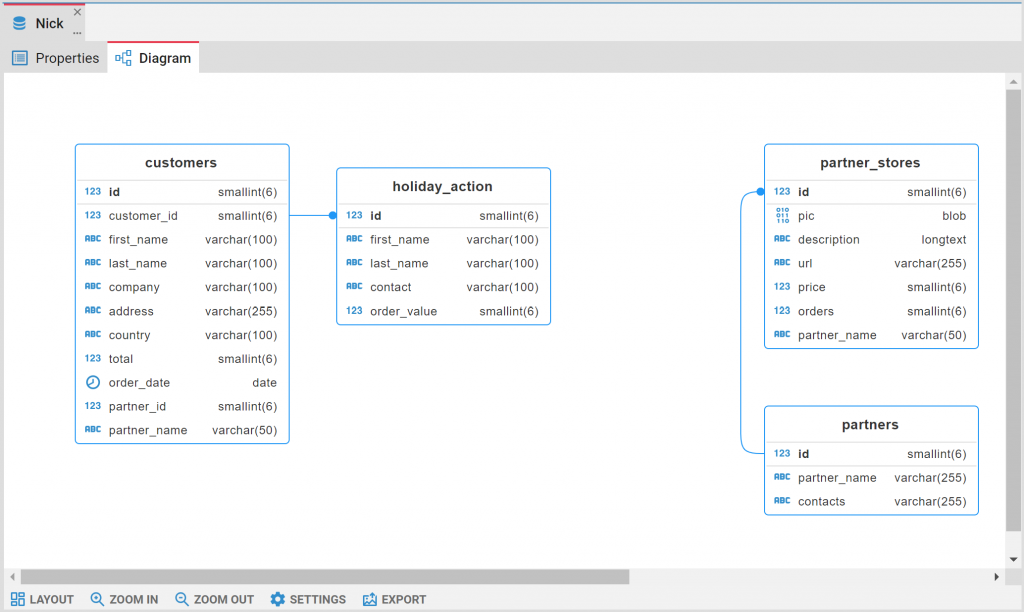
Now, there is a relation between the customers and the holiday_action tables, which is a solid line.
If the foreign key in one table does not serve as a primary key in the related table, the line will be dashed.
Also, they open the holiday_action and see the same number of rows as in the result set of their first query. This means that it now only contains loyal customer data. In the future, they can also check the relationship between the tables using ER diagrams of this or other relations.
Visual parameters of ERD can be changed in the tab settings.
This time, the marketers have figured out the task of obtaining aggregated data. Also, with the help of SQL queries and through ERD, they have ensured that in the future, only the required information will be included in the table with the holiday action participants. In our next articles, we will share even more interesting information about our browser tool and its features.