An Entity Relationship (ER) Diagram is a type of flowchart that illustrates how entities relate to each other within a system. In terms of a database management system, an entity is a table. So by showing relationships among tables, the ER diagram represents the complete logical structure of a database.
ER diagram in DBeaver
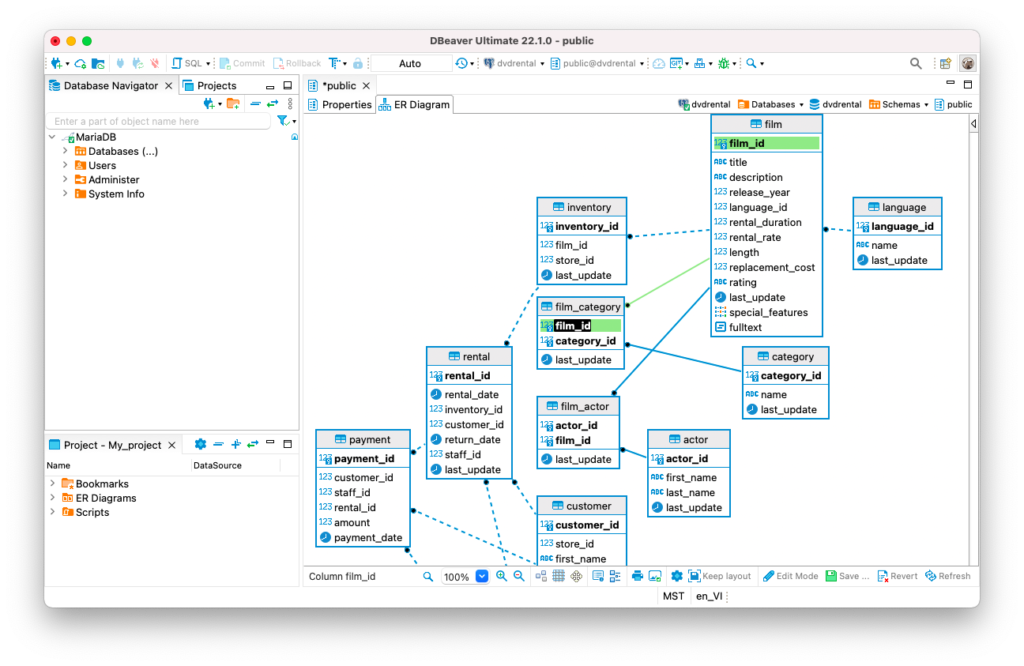
DBeaver allows you to view diagrams for any objects: tables, views, and even entire database schemes. You need to double click on the schema and go to the ERD tab to see the diagram for all the tables and views. You can do the same for any individual table, in which case you will see the tables that the chosen one is linked with.
Entities are displayed on the diagram as rectangles. If the table has a primary key, it will be shown at the top and will be in bold. Thanks to this, you can immediately see which column is the key and whether there is a key at all.
All relationships between tables are shown as lines. If the foreign key can be NULL, a dashed line is used. Otherwise the diagram displays a solid line. Each relationship is represented with circles (for “one-to-many” cases) and diamonds (for “one-to-one” cases).
In the same way as for a database table, you can open the ERD for any view by double-clicking on it.
But please note that there is no relationship between views, so they are always displayed separately.
DBeaver’s ERD are useful in two main cases, which we will cover in this article.
Database ERD for review and navigation
One of the main advantages of diagrams is that they allow you to quickly navigate through the database schema. By opening the diagram, you can understand exactly which database tables are related to each other and what types of relationships are used for this. Click on the line connecting the tables to see the highlighted keys in both of them.
By double-clicking on the desired table in the ERD, you can go to the Data Editor to view or change the data or metadata.
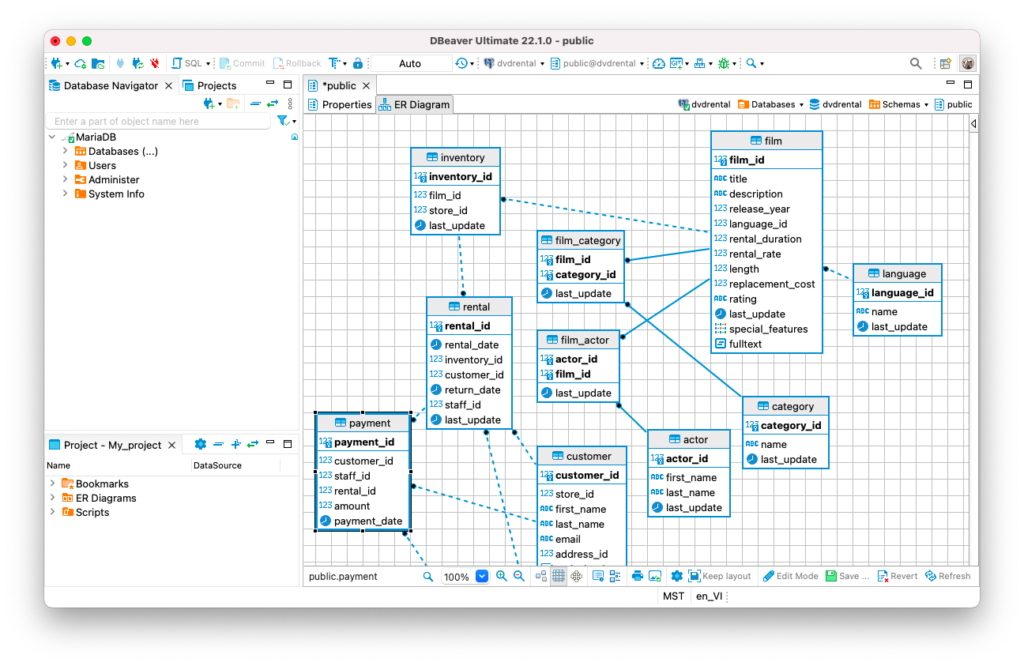
ERD in DBeaver has a large number of display settings, which you can find in the bottom toolbar. For example, if you want to organize your diagram better, you can turn on the toggle grid and arrange the entities more evenly.
For each of the entities, you can quickly view the properties by clicking on the corresponding button.
For the convenience of working with large diagrams, you can click the Outline button and see a preview of the entire ERD with the ability to quickly navigate through it.
Diagrams in DBeaver are highly customizable as you can change the look of your ERD based on your personal needs. To do this, you need to click on the Gear button. For example, you can show data types and metadata for each column. This can be useful if you want to quickly view more information about data stored in tables without going to Properties.
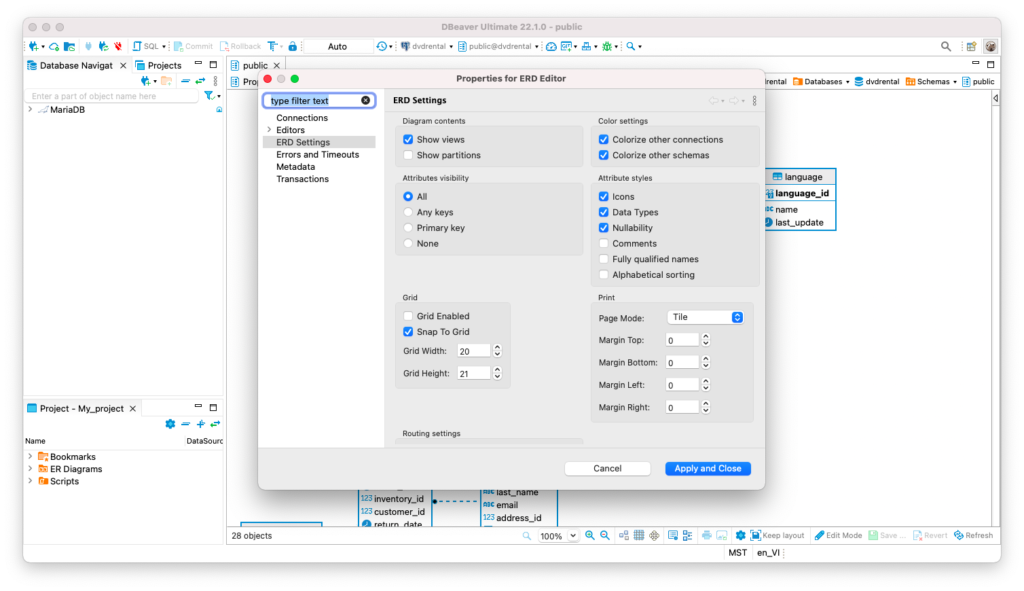
Select the checkboxes you need and click the “Apply and close” button. To display the changes you have applied you need to reopen your ERD.

Creating a custom ERD
With DBeaver, you can both view diagrams for existing schemas, and create your own custom ERD using Diagram Create Wizard. To do this, go to the Project Explorer, right-click on the ER diagrams and select Create New ER Diagram. Enter the desired name for the diagram, select a connection from the list (if necessary) and click on the Finish button.
A custom ERD can be useful in two situations.
To share the diagram
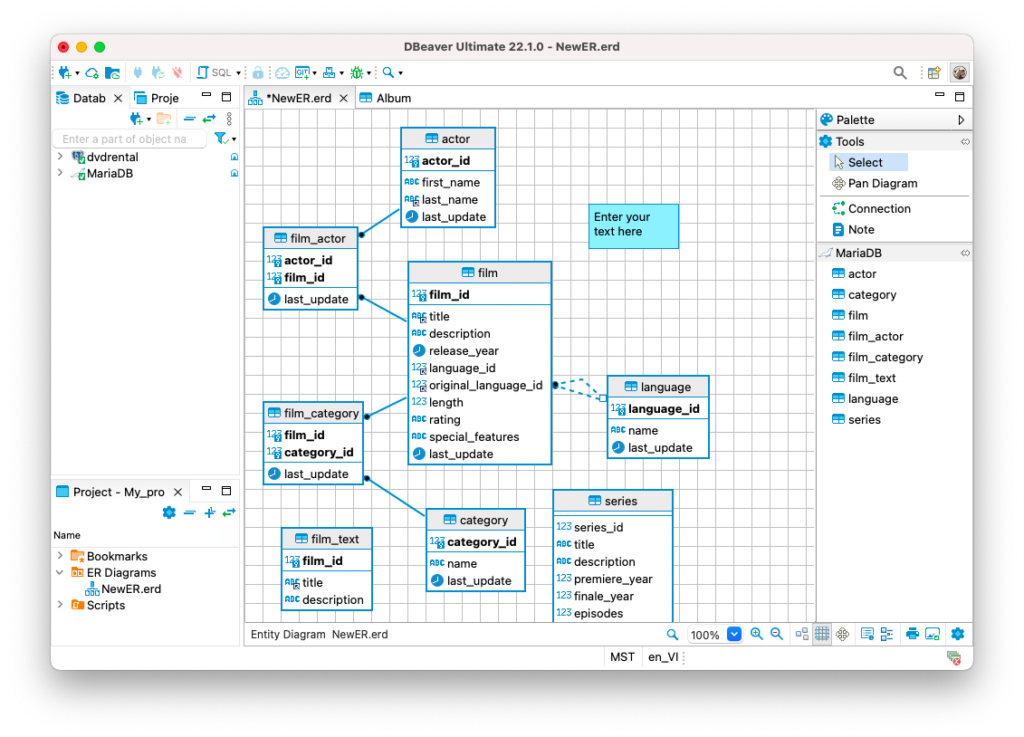
You can create a custom diagram and share it or add it to your report or presentation to help colleagues understand the diagram better. For this, you can try using Notes, which are customizable boxes where you can place any text you want. For example, they may contain details about a particular table or relationships between tables.
To add a new note you need to expand the Palette on the right side of the editor and drag the note into the diagram. You can then place it anywhere in the diagram, enter text, and set the background color.
ERD to design a database
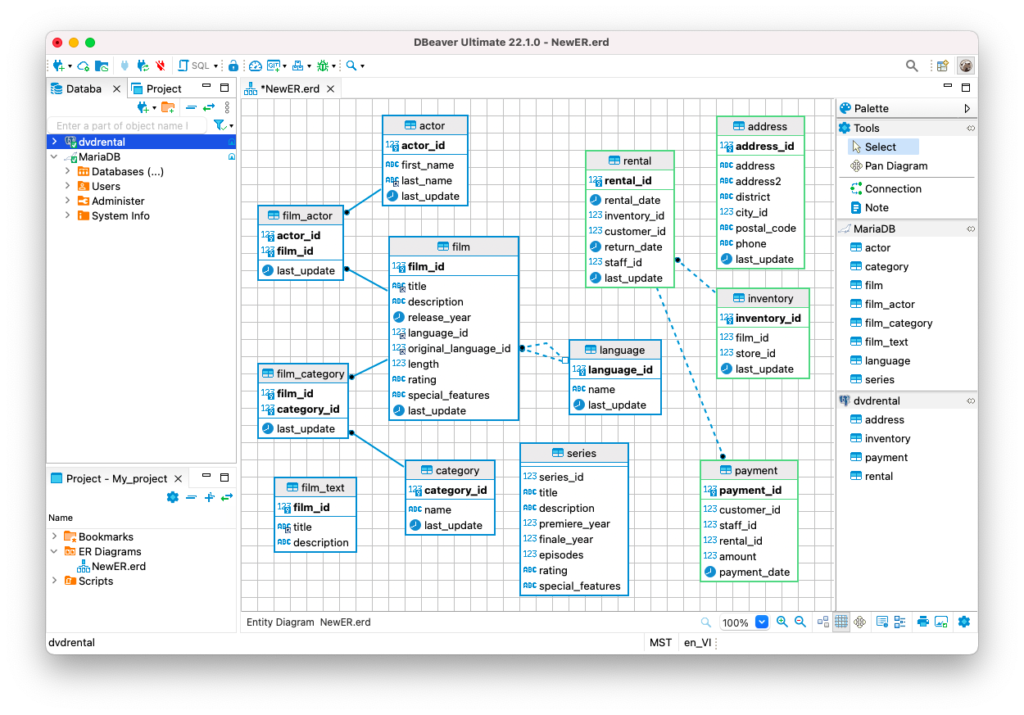
If you want to change the structure of the production database by adding objects from your development database to it, custom diagrams will also be useful for you. By visualizing the scheme of the future database in the ERD, it will be easier to discuss the details of your future design with your colleagues or management.
To create a new ERD you can drag and drop the tables you need from your navigation tree into the diagram window and remove unnecessary entities. The tables you choose can belong to any schema and even to different types of databases. If you add tables from another schema to the diagram, they will be colorized differently by default.
Using the buttons on the bottom toolbar, you can arrange your ERD, print it or save it as a file.
You can use the shortcut CTRL+S (or CMD+S for MacOS) to save your diagram.
Later this file can be found in the ER Diagrams folder in the Project Navigator.
In most cases, ERD are used only for display purposes, and working with them does not make any changes to the database. But sometimes it is convenient to edit the metadata directly in the diagram. DBeaver provides this opportunity, which we will tell you about in our next article.