The Data editor is one of the main parts of DBeaver. With it, you can perform various operations with your data in the tables, including editing, filtering, analyzing, exporting and importing, visualizing, and much more. Let’s take a quick look at the features of this useful tool.
To open the Data editor double click on a table or view in the tree.
You can also see the Data editor as the Result tab after executing the SQL query.
This editor is no different and you can work with it in the same way.</p
The central part of the Data editor is the data table. You may notice that the table in the Grid mode is very similar to an Excel spreadsheet.
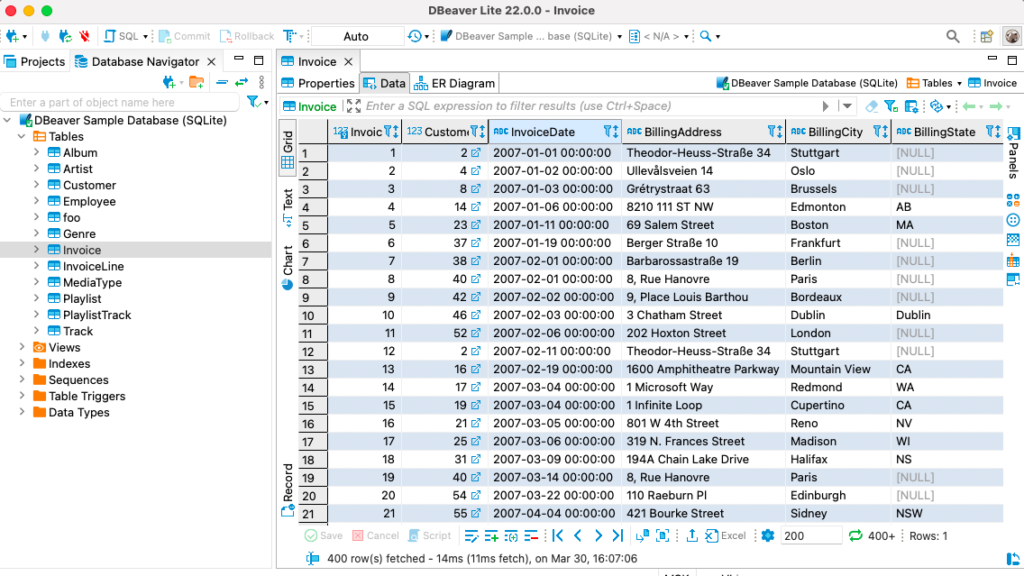
And it is true, you really can work in this mode in almost the same way as you do in Excel. However, the Data editor is more powerful than it might seem at first.
For example, if several users edit the same table, you can use auto-refresh and see updates in real-time. This setting is configurable, and you can choose the refresh time intervals.
Using the Filter field and Top toolbar you can enter an SQL expression to filter results. Your filter history is also available here. If you are using DBeaver PRO, the history will be saved even after restarting the app.
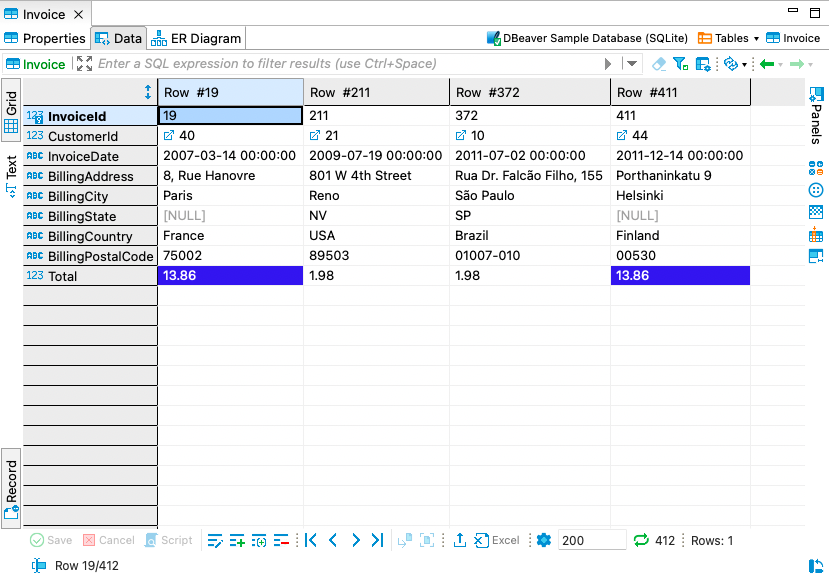
If you select one or several rows in your table and click the Record button in the side toolbar of the editor, the rows and columns switch positions. The Record mode is useful if the table contains numerous amounts of columns. It works just like a table, but for only one or several rows that you have selected.
By switching to this mode, you can conveniently copy data from one row to another if they are far apart in your table. To navigate from row to row of data, use the navigation buttons on the bottom toolbar of the editor.
To know how many rows the data table contains, click the Calculate total row count button in the bottom toolbar. The number of rows appears in the status field. You can use the bottom toolbar to add new rows or delete existing rows, duplicate the current row or edit a selected cell value. For this purpose, it is convenient to use shortcuts.
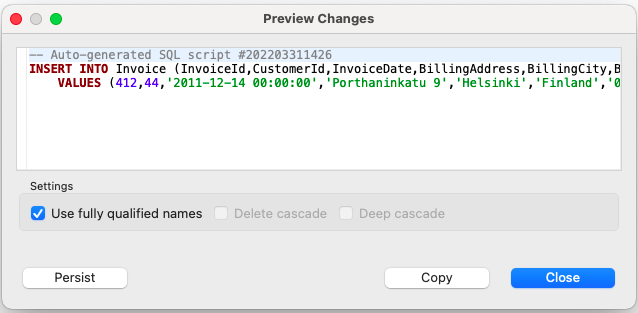
When you finish working with the table, click on the Save button on the left side of the bottom toolbar. Before your changes are saved, you will have the opportunity to view the DDL. To open the preview just click on the Script button.
There are great opportunities for working with data in the table provided by the context menu. You can open it by right-clicking on the cell. In the menu that opens, you can filter, highlight or sort data, edit the contents of the cell, and much more. For example, here you can apply filtering using the value from the clipboard. Just copy the value you need from any source, right-click on the cell, go to Filter -> Clipboard and select the appropriate option. Then only the rows matching the filter will be displayed in the editor window.

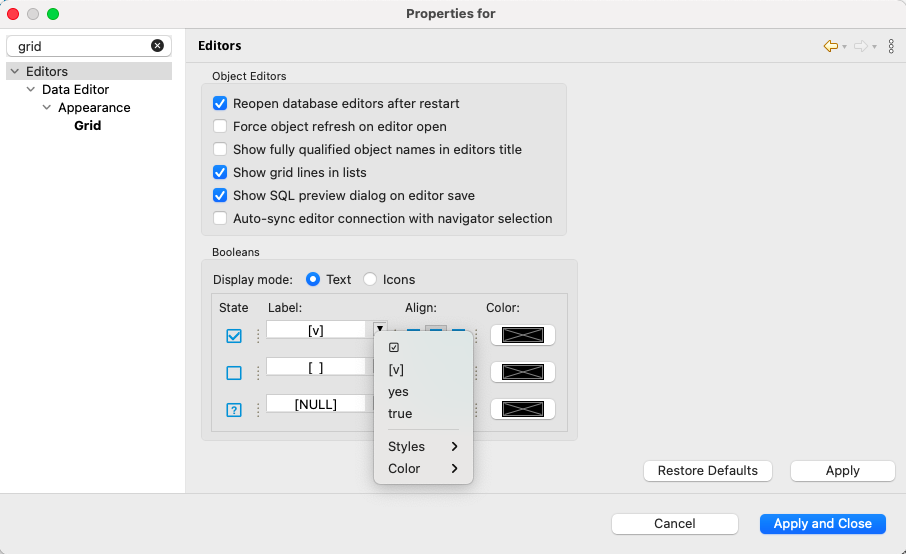
The data editor is very flexible and you can customize it according to your needs. For example, many users want to change the booleans view. This can easily be done in Properties. Click on the Gear icon, go to Appearance -> Grid and click on the “Configure booleans view – ‘Editors’”. Here you can choose how your booleans will look: as icons, checkmarks or words, for which you can set the font color.
In the same way, you can customize other Data editor properties, change data formatting, font size, etc.
If you want to open the table you modified in Excel or export the result set into a file, click on the corresponding button in the bottom toolbar.
It is impossible to fit all the features of the Data editor in one article. In one of our next blog posts, we are going to tell you about Panels and how to use them.