The Data Editor is one of the most powerful and useful DBeaver tools for most of our users. It allows you to view and edit data and metadata, visualize data, generate result sets for reporting, and much more.

But did you know that the Data Editor has default colorization settings that you can change and the grid will look like this? Let’s try to do so.
Changing the general view of the grid
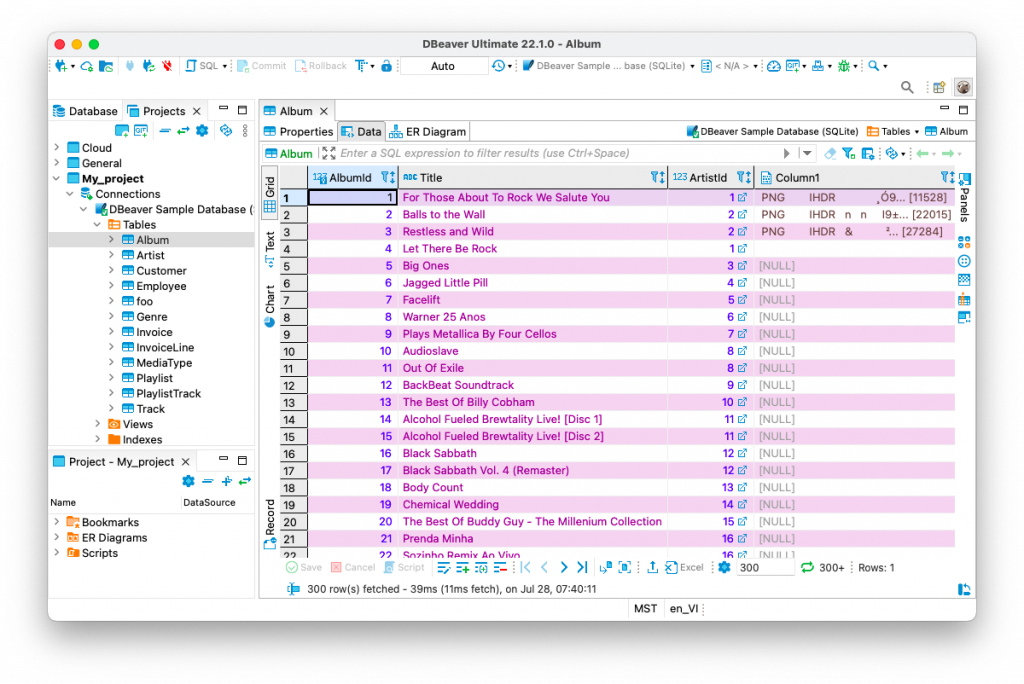
Even rows in the Data Grid have a white background, and odd rows have a light blue background. This is done for the convenience of the visual perception of the data.
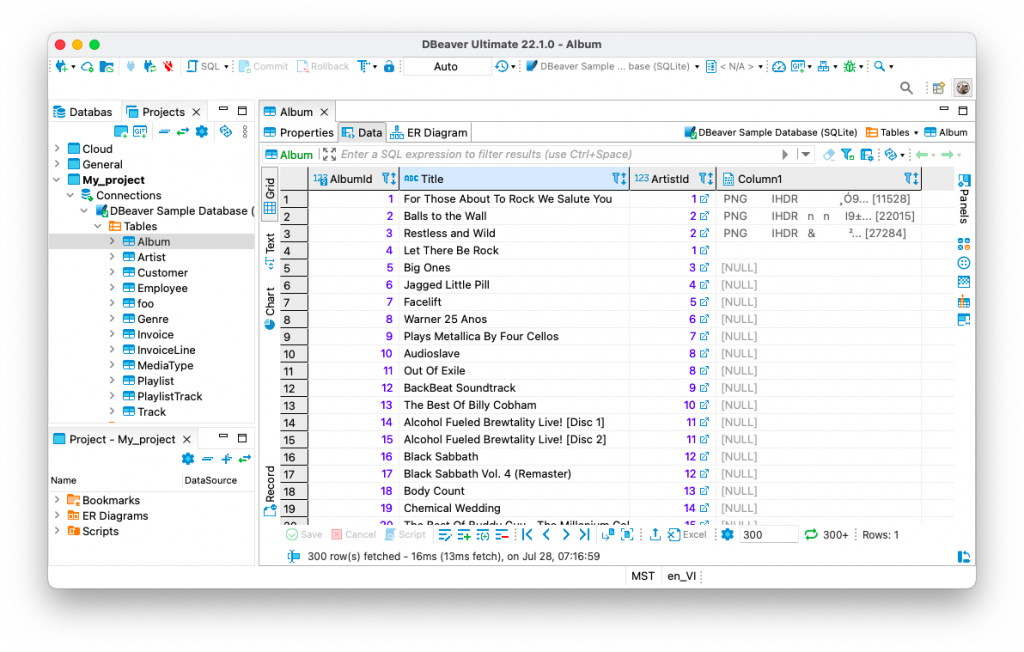
If you want to make all your rows’ background white open the Main menu and find the required settings section.
Yes, it’s not very easy, but still possible. Go to Window -> Preferences -> General -> Editors. Choose Data Editor, go to Appearance -> Grid and uncheck the box “Mark odd/even rows”.
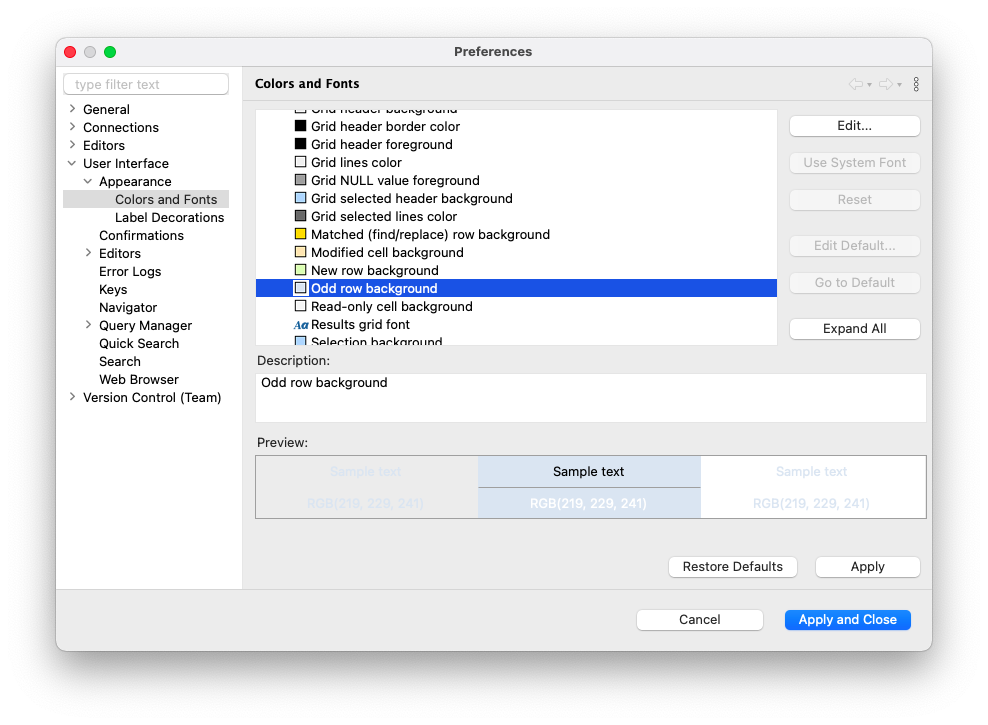
If you would like to set a different color for odd rows, you can do so in the global settings of the app. For our example, we chose a light pink color. To do the same (or set any other color you like) you need to go to Preferences -> User Interface -> Appearance -> Colors and fonts. In a folder called Database Query Results, you will find the item “Odd row background”. Double click on it or select it and click on the Edit button.
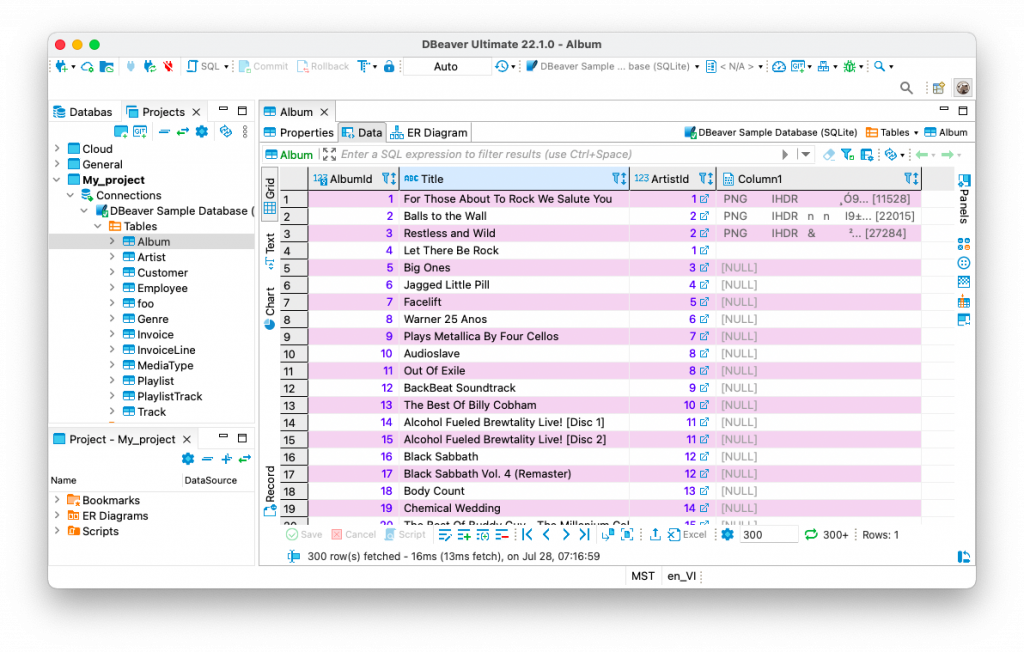
Now you can choose from a set of colors or use the palette to set your custom color. Click the Apply and Close button, and you will immediately see the result in your Data Grid.
Distinguishing data types
Database tables can contain many different data types, and it is sometimes easy to confuse them with each other. For example, the String type data type can contain any characters, and you have to look at the column header every time to distinguish it from a date or a number. This issue is especially relevant for tables with many columns that you often need to horizontally scroll to find the data you need.
To make it more obvious which data types are used in cells, you can colorize the main five of them. To do this, you need to go to the same global settings item that we described above and open the folder “Resultset Data Types”. Here you can see the default colors for binary, boolean, date/time, numeric and string data. You can change any of these settings.
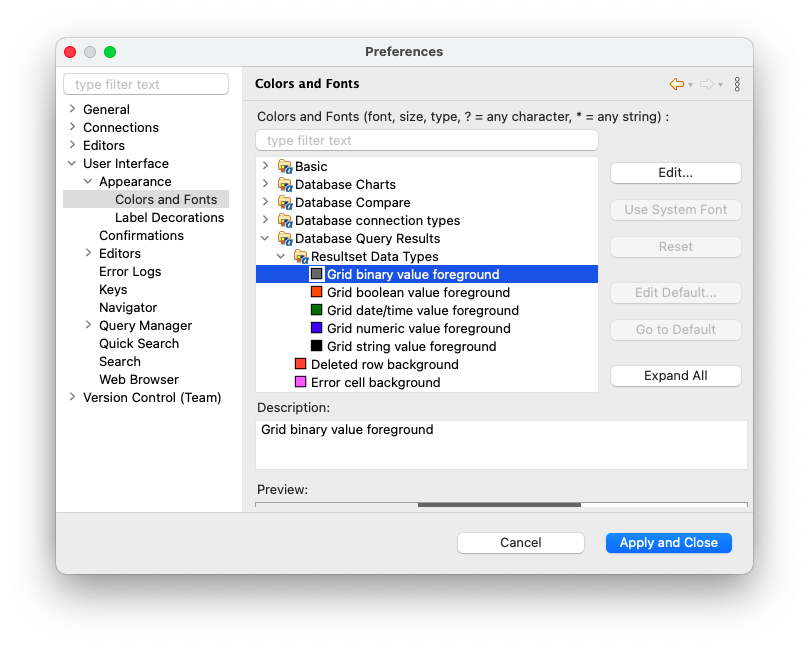
Please note that in this settings section, you can change the colors and fonts for many other UI elements of our app.
For example, here you can make your string values purple and binary values brown. These colors are quite contrasting and will look good on the light pink background we chose earlier.
To see the results of your customizations in the table, you need to right-click on any grid cell and go to View/Format -> Colorize Data Types.
To completely change the appearance of our application, you can choose one of the color themes.
Now you know how to customize the appearance of the Date Grid to your taste. If you want to quickly find the desired values in a large table, you can use cell colorizing. We will tell you more about this feature in our next blog post.