In one of our previous blog posts, we talked about what opportunities DBeaver provides to financial analysts. Data Editor features may come in handy not only for them but also for other specialists working with large amounts of data. Today we will tell you about one of these features, it allows you to colorize certain values in your table.

How to quickly colorize values in your table
The hero of our blog, Louis, works with a large number of invoices on a daily basis. To quickly find the desired values in a large table, he can use row colorizing. This time he needs to make an organized presentation for his boss. To do this, Louis only wants to highlight cells containing payments between the range of 10 to 26 dollars received from customers in Canada and USA. Let’s see how he can do it in a few clicks.
Louis needs to right-click on any cell in the data grid and go to View/Format -> Row colors. In the window that opens, he chooses the Total column and clicks the Add button. To visualize the increase of the values in rows by the payment size, he can apply the gradient.
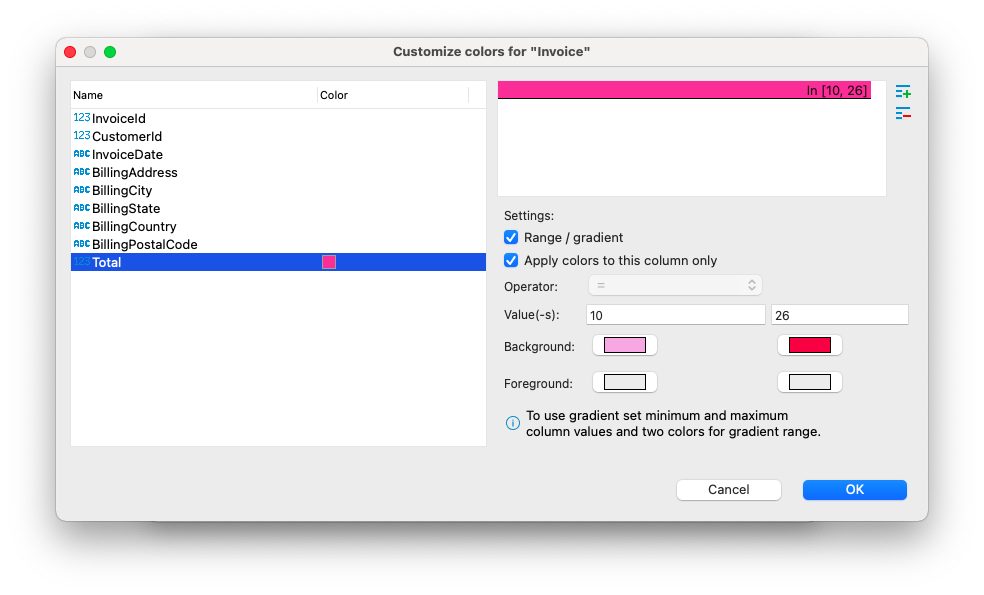
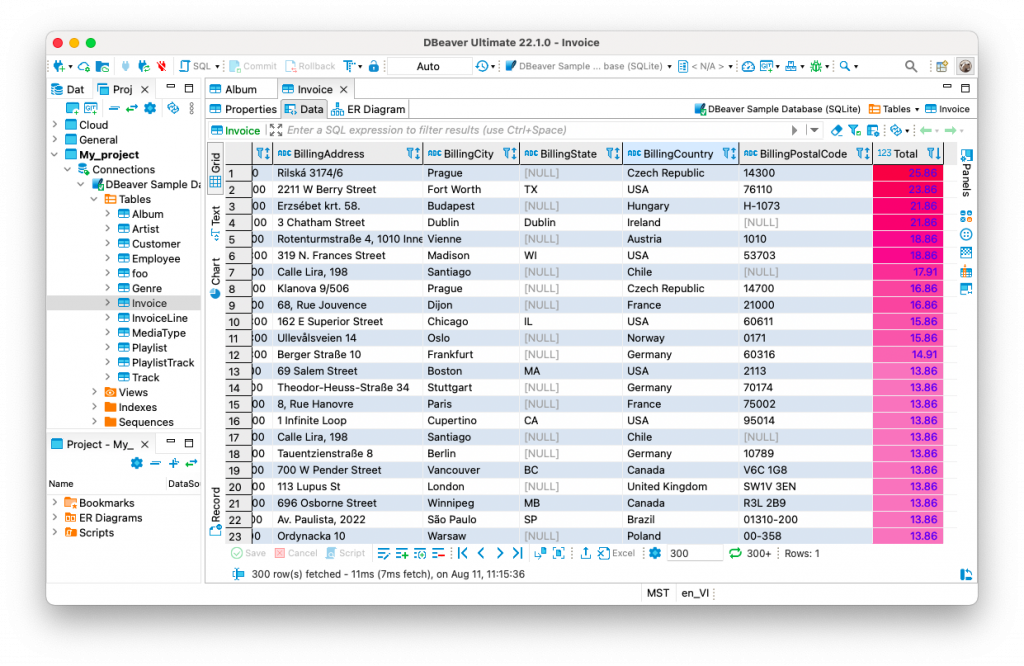
After adding the necessary settings, our hero clicks the OK button. He can now see a smooth transition of colors in his table from the minimum to the maximum value.
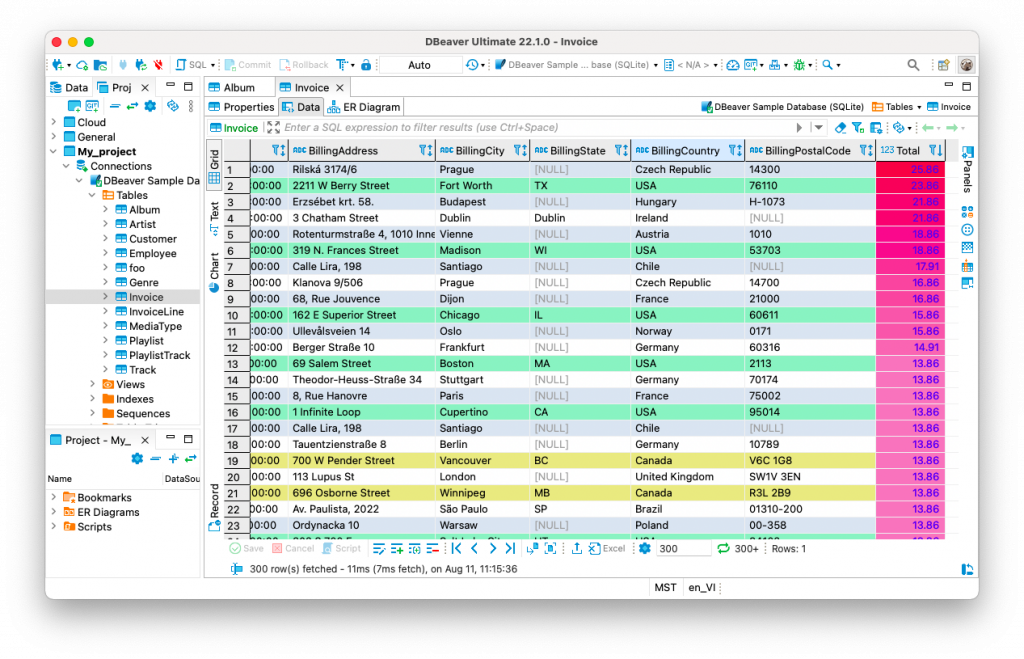
It’s possible to combine the colorization of different columns in one table. Since Louis is only interested in payments from customers in Canada and USA, he can add a color setting for them.
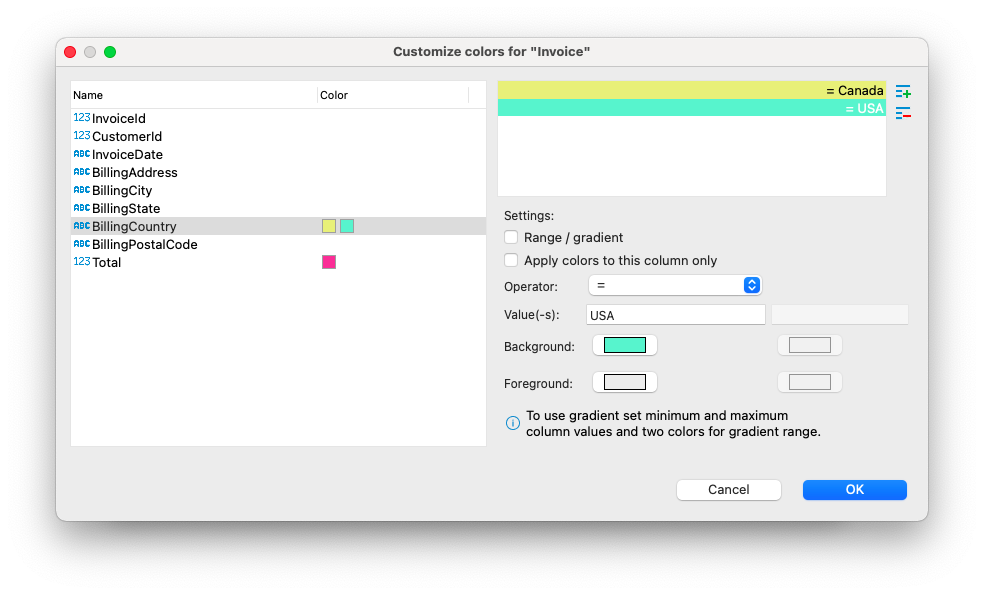
To do this, he selects the BillingCountry column, clicks the Add button, enters “USA” in the Value field, and sets the color. He then repeats these steps for Canada but chooses a different background color.
After Louis has shown his boss the finished presentation, he can undo the settings he made. To do this, he needs to go to View/Format -> Row colors again, select a column in the right field and click the Delete button. He can also do this by right-clicking on a cell with colorization and choosing View/Format -> “Clear color for…”.
Now you and Louis know one more way to customize the Data Grid for better data perception. You can combine it with the colorization settings that we told you about in our previous blog post.