Our hero Louis recently mastered using DBeaver’s Desktop App. But after a short time, his company came to a few marketers for whom databases look and work just like an Excel spreadsheet. Nevertheless, working with data makes up a large part of advertising professionals’ tasks, such as research, editing, and exporting.
So Louis’ boss decided to speed up their routine and execute the plan: the company integrated CloudBeaver into their work – it is easier to start using than the DBeaver, and users can work with it in the browser
CloudBeaver’s Data Editor is a powerful tool that has a similar appearance and functionality to the desktop product. For example, with the Data Editor, users can conveniently sort out and filter data to quickly find the information or group the data they need by specific criteria. For example, they can find a customer’s country or even a certain address.
Let’s look at how Louis helps his new colleagues work with CloudBeaver.
How to get started
Louis begins by showing the young padawans apprentice marketers where to click and what to look for in the platform interface to research for or edit data for their advertising report. Louis’ new colleagues need only to log into a corporate account to access all their databases, which are connected to CloudBeaver because their IT department would have done this for them. Immediately after logging in any user will see a list of databases on the left side of the web app. We call this feature Data Navigator and a tree of objects.
To open the Data Editor in CloudBeaver, users can either double-click on a table in the Database Navigator or right-click on the three horizontal lines next to the table and select “Open”. Louis shows them an example and opens the Invoice table with their customers’ orders.
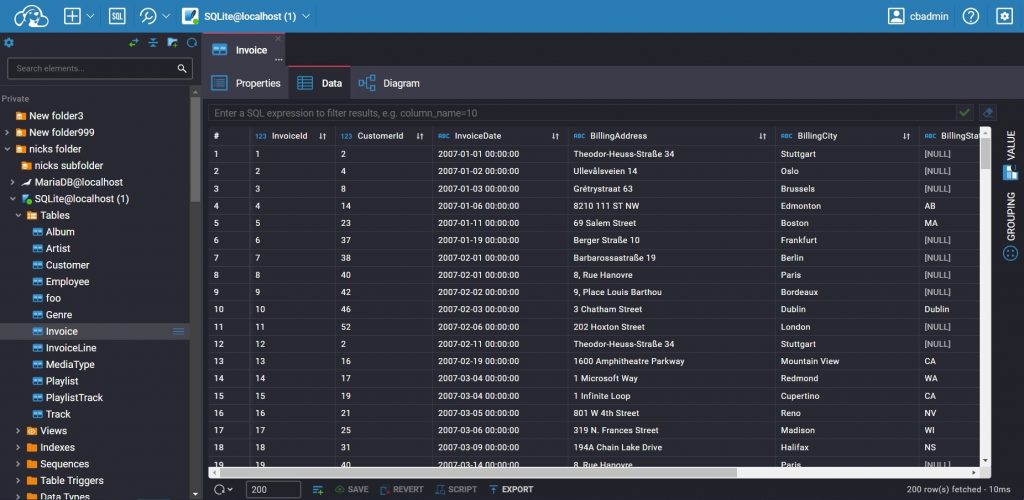
The central part of the data editor is the Grid mode table. It is similar to an Excel spreadsheet, and the familiar interface makes it quick for new users to work with the data.
Update and filter data depending on users task
Once users have opened the Data Editor, they will see a table with data. They can use the arrow keys or mouse to navigate through the rows and columns.
Louis then shows them how to filter data based on their objectives.
The best example he comes up with is for his students to search for customers from Edmonton. To do this, they can enter the column name and the value they want in the Filter field at the top of the data editor, and then confirm the action. In this case it is BillingCity = ‘Edmonton’. Done! They have seven different orders coming in from Edmonton at once!
If they click on the Total column heading, newcomers can highlight all the completed cells in it and copy them if necessary. If our heroes click on the ordering icon in the column, they can see the cost of each order from Edmonton in descending or ascending.
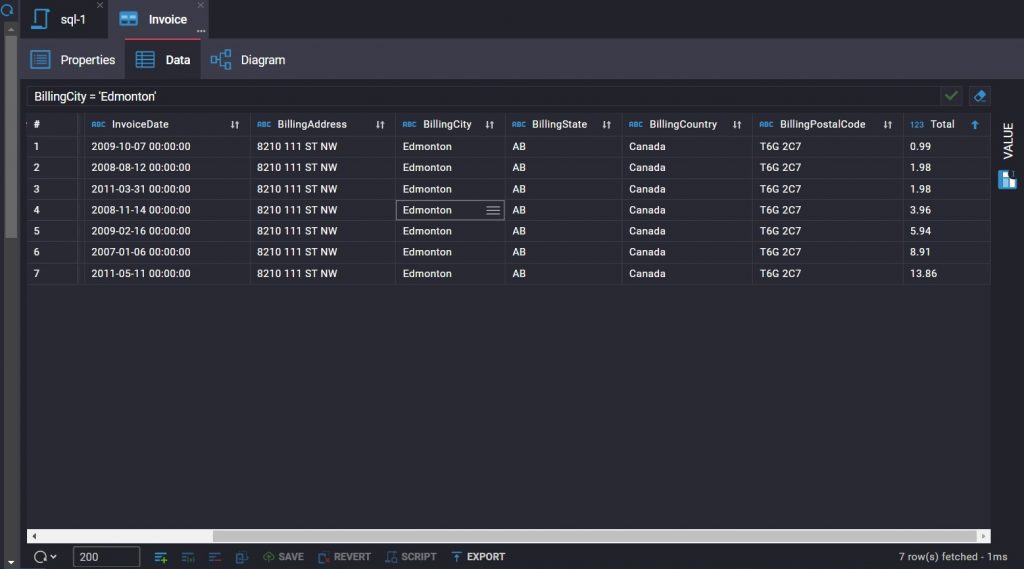
Louis reminds marketers that working with the database does not end here because it is now time to edit the data in the filtered table that has already been filtered. He notices that the order amount from Edmonton dated 11 of May 2011 is not 0.98 but 2.45. To edit this data, all that has to be done is to click on a cell and start typing.
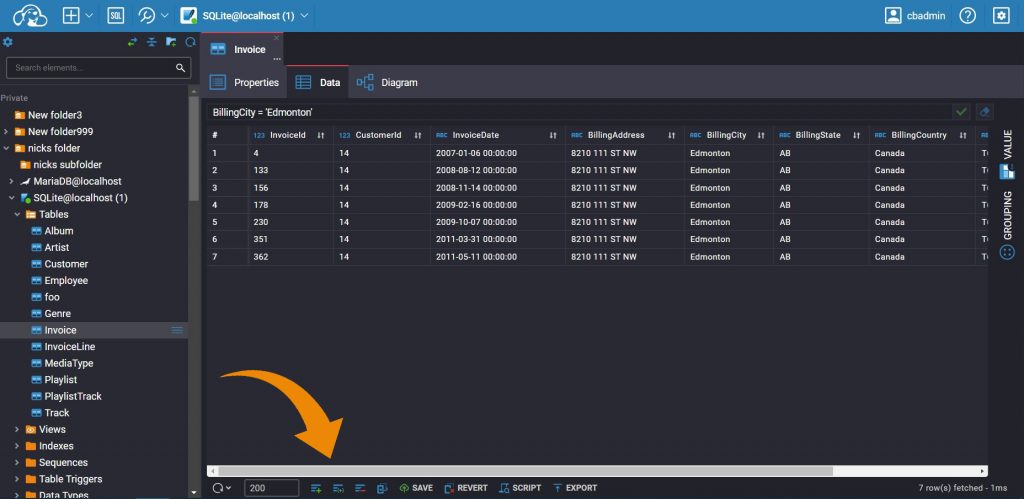
The number of lines is displayed in the status field. Using the bottom toolbar, users also can add new lines or delete existing ones, duplicate the current line or edit the value of the selected cell.
Use keyboard shortcuts to work quickly.
To add a new row, select a cell at the top of the table and press Alt+Insert.
To duplicate a row, add Ctrl to this combination.
How to save or revert users edits
When the users finish working with the data, they need to click the Save button on the left side of the bottom toolbar to submit the results.
But before saving the changes, marketers or other users have the opportunity to preview what they have adjusted in the database. To open it, they need to click the Script button.
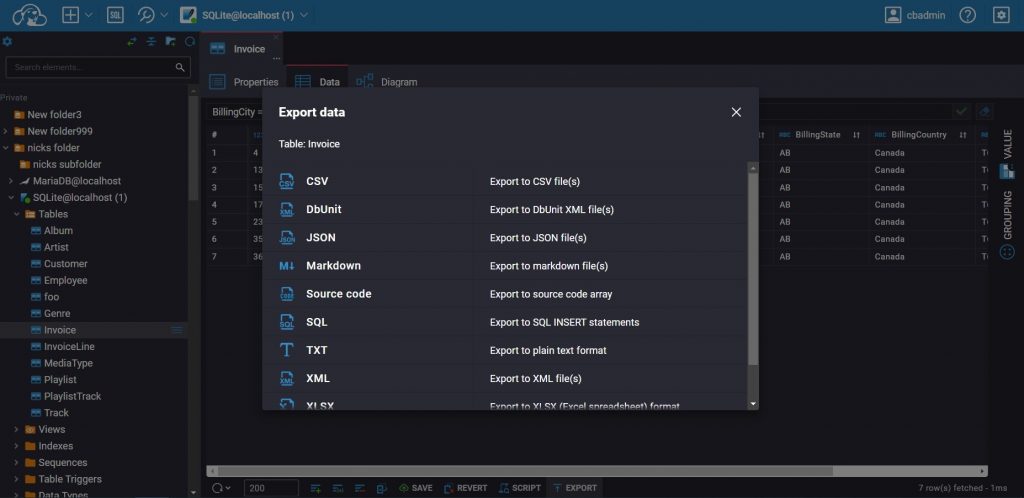
New users may also notice the Revert and Export buttons on the bottom toolbar. Pressing the Revert button will undo any unsaved changes. With the Export button, marketers can save a changed Invoice table with the data as a file in the format they want. Then with the exported data Louis’ students can make any advertising reports.
There is a reason CloudBeaver is considered an effortless and accessible tool for interacting with databases. In just one lesson, Louis promptly explained to his new marketing colleagues how to view, edit and export tables from databases. Our heroes will continue to explore the features that are available to CloudBeaver users in next articles.