Data Editor is a useful and often necessary feature for working with data in CloudBeaver. Its functionality is not limited to editing the table in Grid mode and sorting with the filter field. Users can also work with data in Value and Grouping panels, allowing you to change, view and sort data conveniently.

Today, Louis and his marketing team will explore ways to use Value and Grouping Panels when working with tables.
How Value Panel allows users to edit lengthy texts
The Value Panel is a feature in the Data editor that provides users with the extra space to manipulate data such as complex data types, long text data, or BLOBs.
The first task they will face today is editing product descriptions. These masses of words are in the same table with the products’ pictures and the partner stores’ URL data which appears as a text . Because the texts about the products in the columns are too long, it is more convenient to check and, if necessary, change them in the Value Panel rather than in the table itself.
First of all, they go into their company’s corporate account. Instead of creating a new connection, they find the partner_stores table with data to use in the tree of objects. Users open the panel by clicking the Value button on the right side of the Data tab.
Another way to open it is by clicking on a cell and selecting Show in the Value Panel.
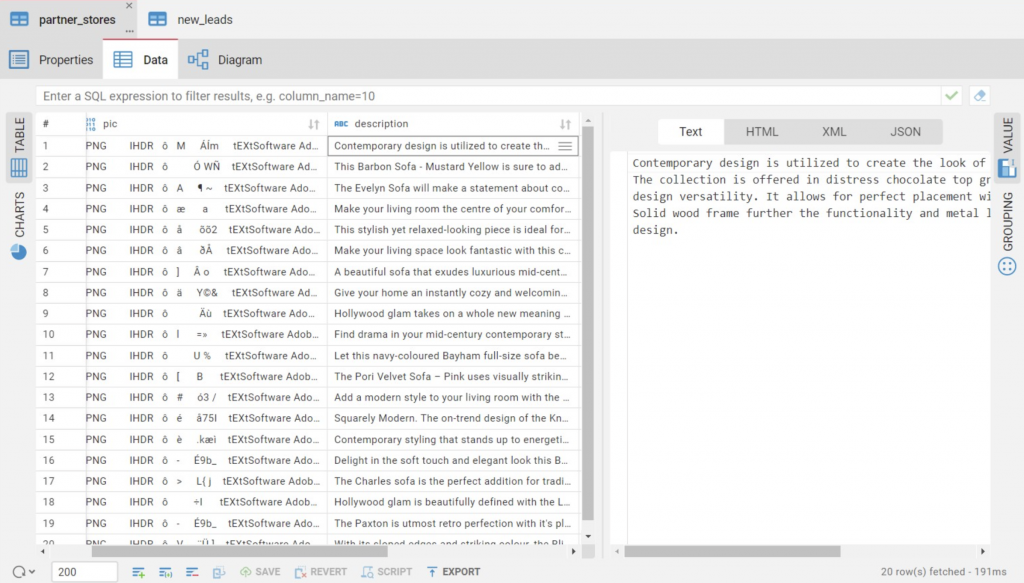
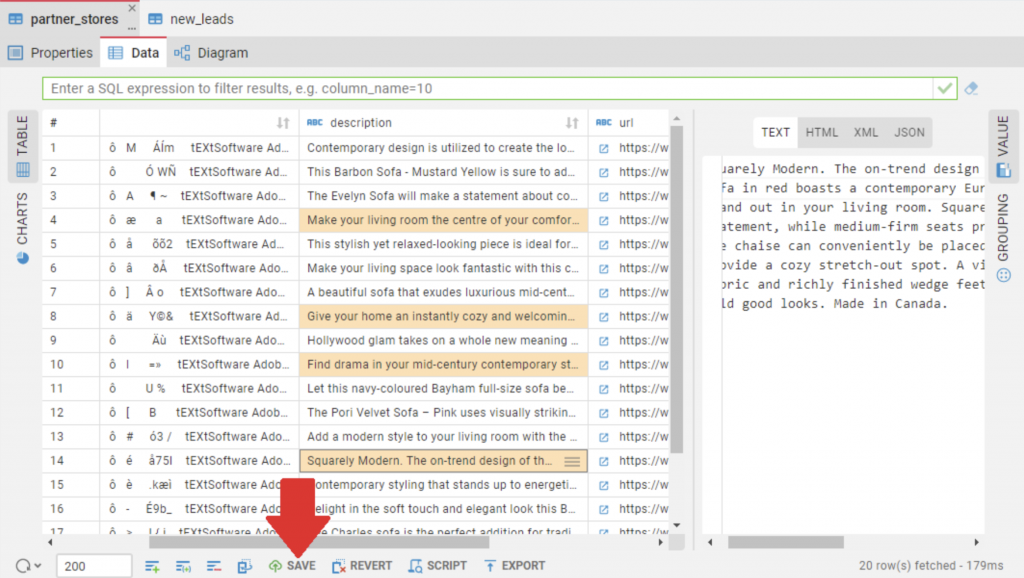
Our heroes have a lot of applied work because there are 20 rows in the table. They notice inconsistencies in several cells with product descriptions, so they take turns opening and editing them in the Value Panel, then saving all changes.
They also open matching pictures in the Value Panel and check them. If the correct BLOB is specified in the table, it will be displayed as an image in the feature window on the right. It can also be downloaded to the local device by clicking on the Download button.
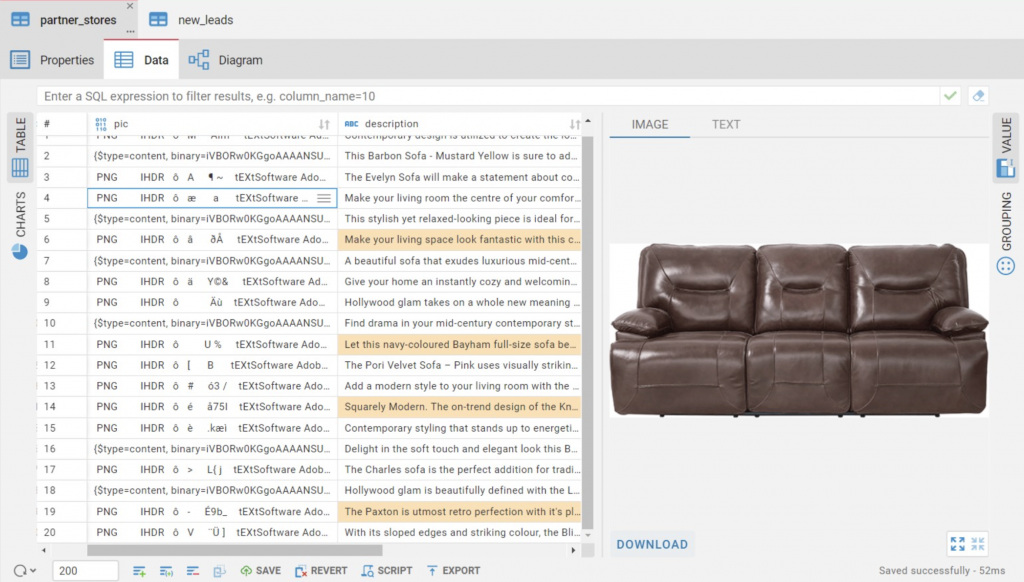
Since the product pictures were correct and the descriptions were fixed, they did a great job.
How to count and export the necessary data from the Grouping Panel
Data from loyal customers needs to be collected from the new_leads table to send out a list of affiliate stores that offer discounts on merchandise.
The work they started in the Value Panel will continue in the Grouping Panel. This is where Louis students will find out which customers are making the most orders and which will receive a newsletter with good deals from the company’s partner stores.
They open the Grouping Panel and then drag and drop the necessary columns from the table into it.
They use the Count feature of this panel which plays the number of mentions of a single value in a particular column. It is now possible to find the customers who have placed two or more orders.
They can drag the contacts column into the Grouping Panel and sort the count_ column from larger to smaller.
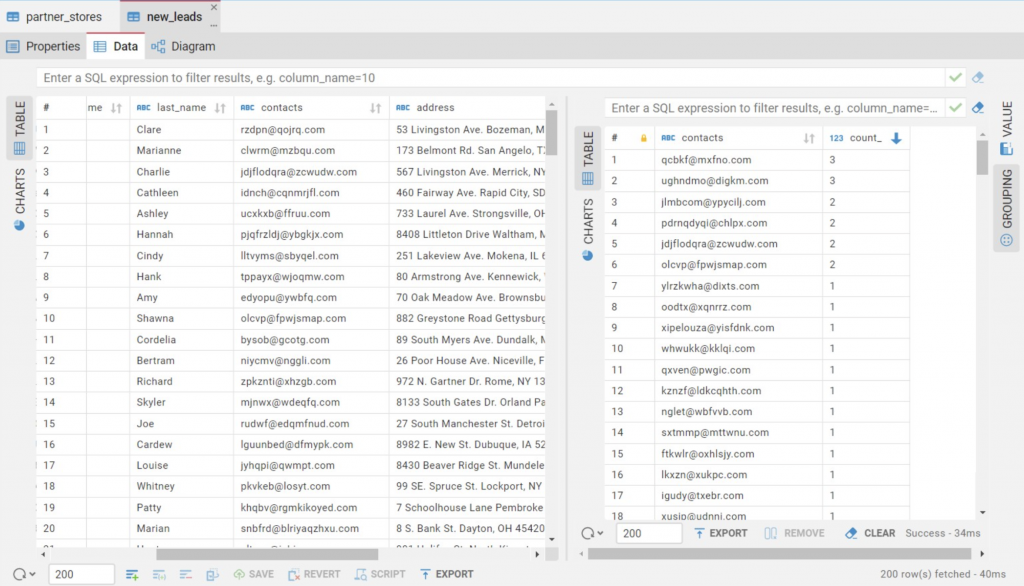
The Grouping panel has an Export button in the bottom toolbar. And the heroes will use it. So they download the new table as an Excel file to work with the email list outside of CloudBeaver.
Read about how else you can export data from CloudBeaver solution in our blog article.
Marketers mastered editing extensive text data in the Value Panel and identifying the most loyal customers from one table into the Grouping Panel. This time they went through the whole process without mistakes and also managed to perform several work tasks at once – the boss is pleased with their practice in CloudBeaver. In the following articles, we continue to learn how you can use our browsed-based solution.