DBeaver Team Edition is a comprehensive platform, encompassing the full functionality of DBeaver PRO and CloudBeaver, designed to streamline collaboration and data-driven decision making in a secure environment. By consolidating essential tools for data access, analysis, and sharing, DBeaver Team Edition empowers teams to unlock the full potential of their data while ensuring confidentiality and encouraging seamless teamwork.
Today, we’ll follow marketing analyst Emma as she tackles a common challenge: analyzing customer churn. Her task requires access to sensitive customer data, but granting unrestricted access poses security risks and could overwhelm her with irrelevant information. DBeaver Team Edition addresses this issue by providing a secure framework for data access and analysis.
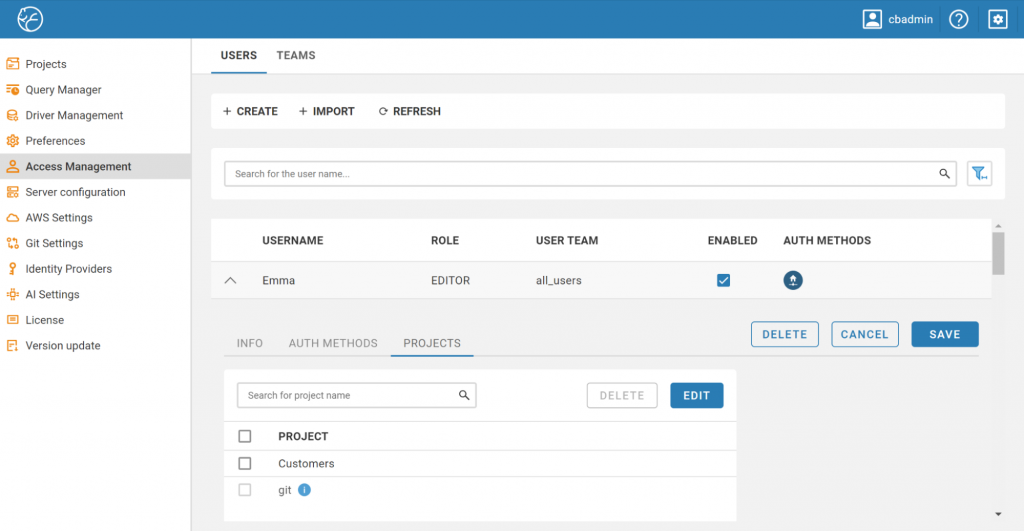
Within Team Edition, projects act as centralized hubs for team collaboration and housing connections to relevant data sources. Each team member is assigned a role that defines their access level. In Emma’s case, her Editor role grants her the necessary permissions to work with the data without delving into complex configurations.
Read our blog to learn more about roles for Administrators, Developers, Managers, Editors, and Viewers, and why they’re important.
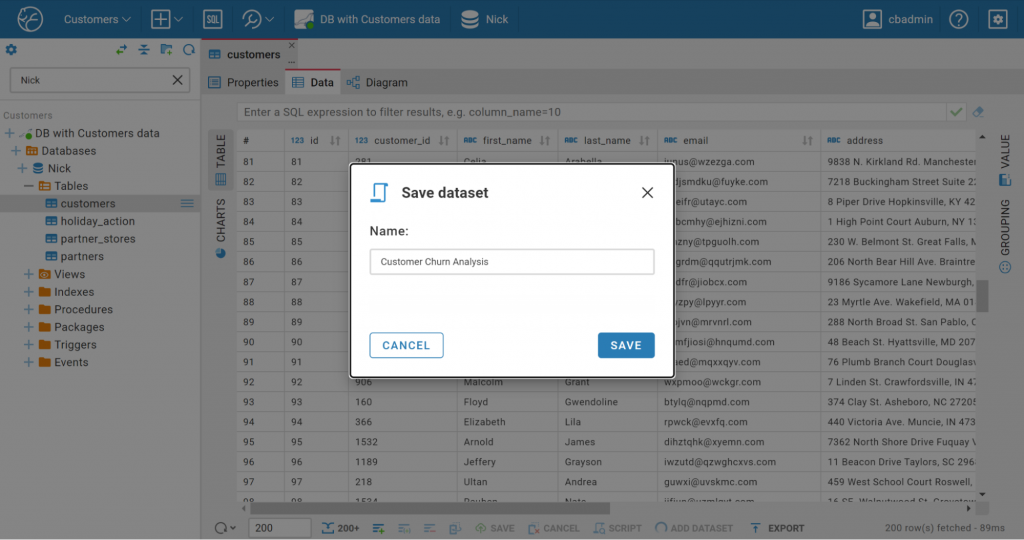
Team Edition empowers Administrators and Developers to curate and manage datasets, tailored subsets of query results, streamlining data access for their colleagues. By granting permission to specific datasets, roles with higher permission access levels can ensure that business users like Emma can focus solely on the relevant customer data, thereby eliminating distractions from extraneous databases or tables. This granular control enhances both security and efficiency, allowing everyone to work with the precise data they need.
Emma’s Manager created a separate dataset for the analysis and named it Customer Churn Analysis. Once this dataset is added to the project, Emma can find it in the CloudBeaver interface.
More about creating Datasets from the Manager perspective can be found in the documentation.
Exploring Data with Charts
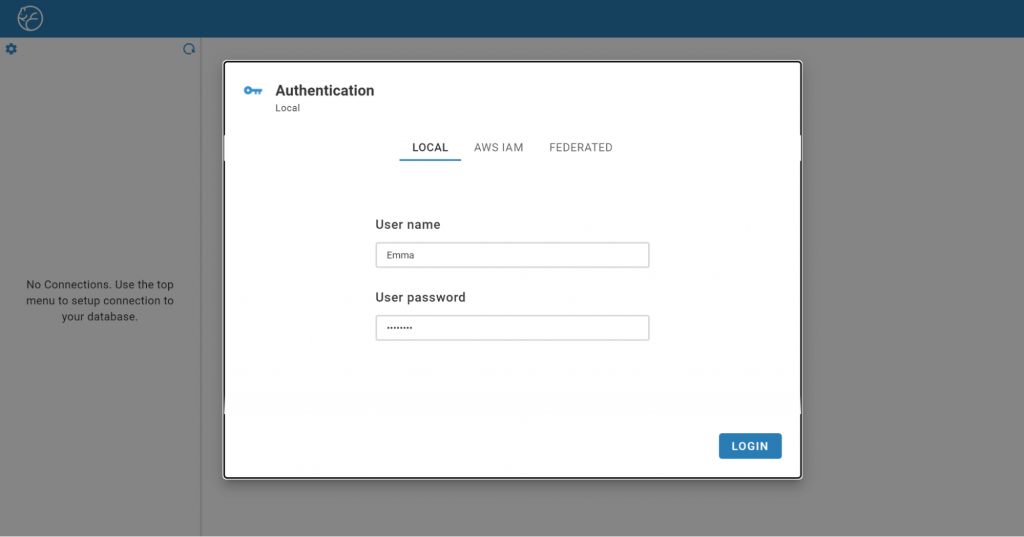
Emma’s primary goal is to develop data-driven retention strategies, so she begins by logging into her account to analyze and identify relevant patterns.
With the “Customer Churn Analysis” Dataset, Emma can leverage DBeaver’s Charts feature to gain valuable insights quickly:
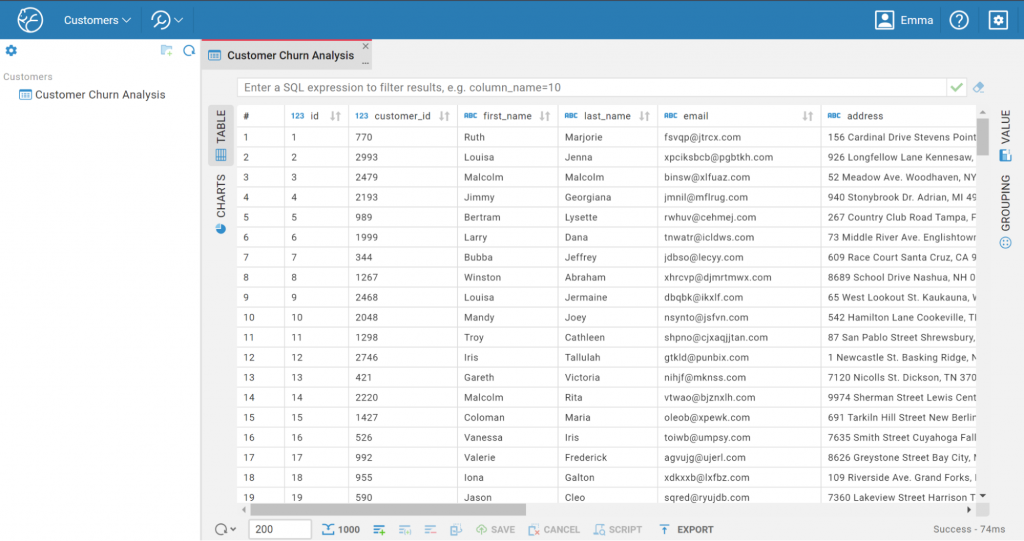
1. After connecting to the required table with admin-issued credentials, Emma opens the “Customer Churn Analysis” dataset. She is able to view a table with data about customers that have churned.
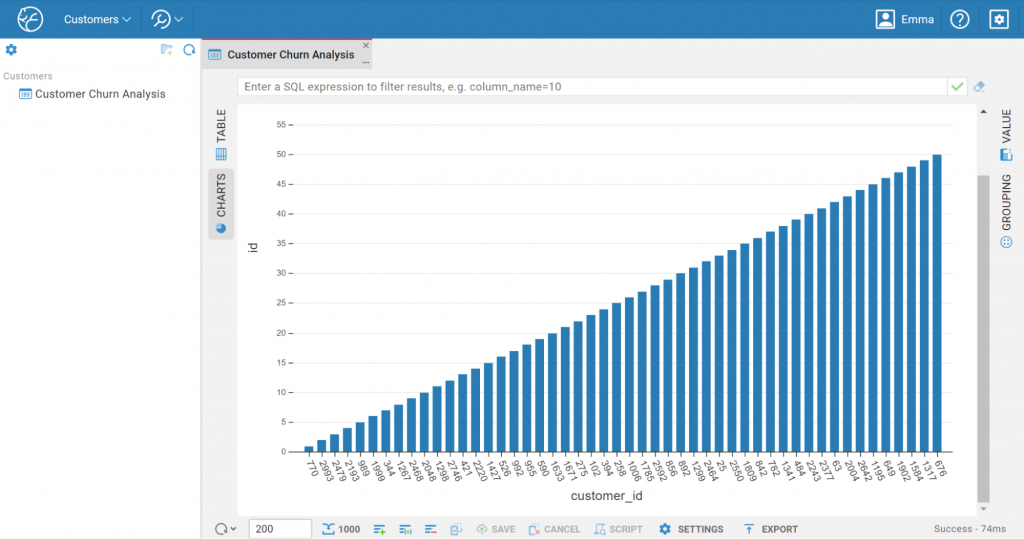
2. She clicks the “Charts” button on the left vertical toolbar in the Data Editor view.
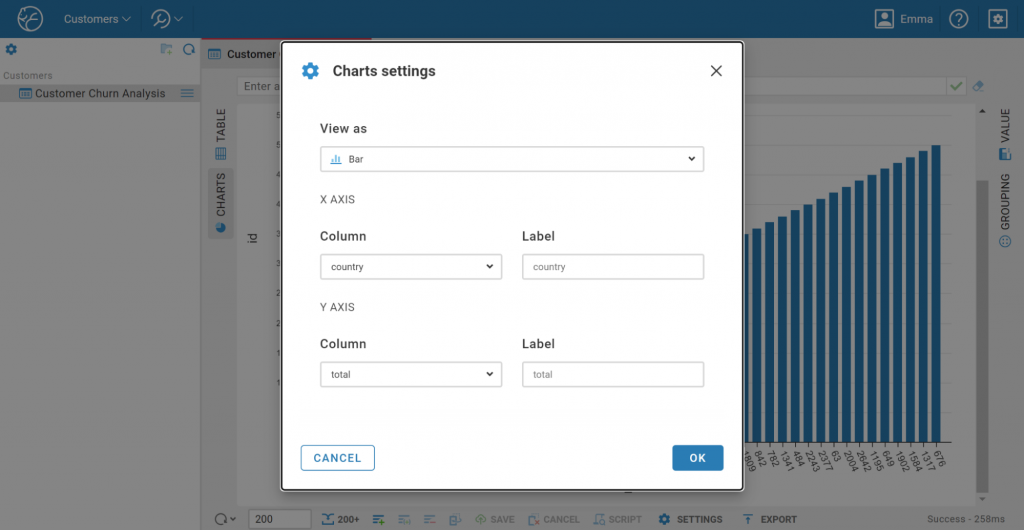
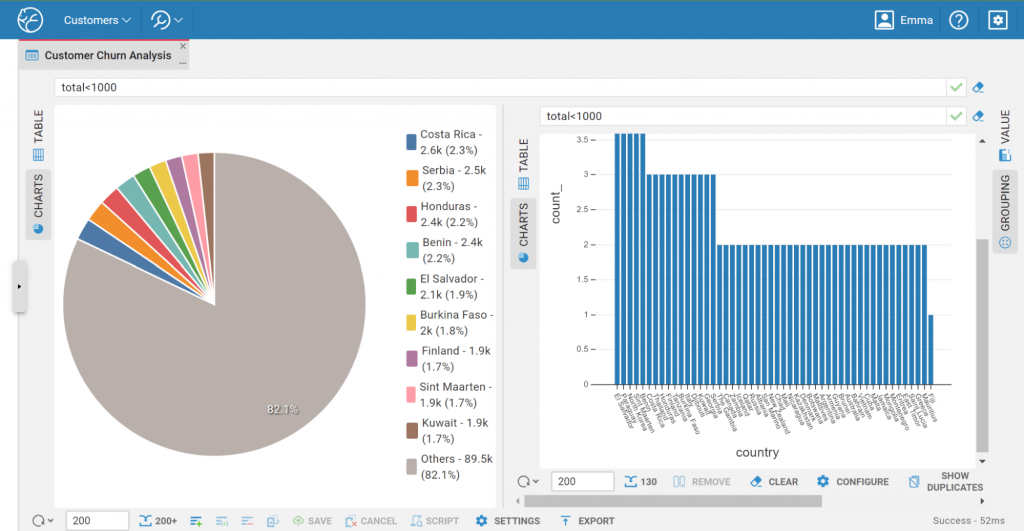
3. Emma wants to determine the countries with the highest churn, so she sorts the data by choosing to view the chart as a bar chart with these specific columns and labels.
4. The customer data instantly transforms into a visually appealing bar chart, with customer segments on the X-axis and churn rates on the Y-axis.
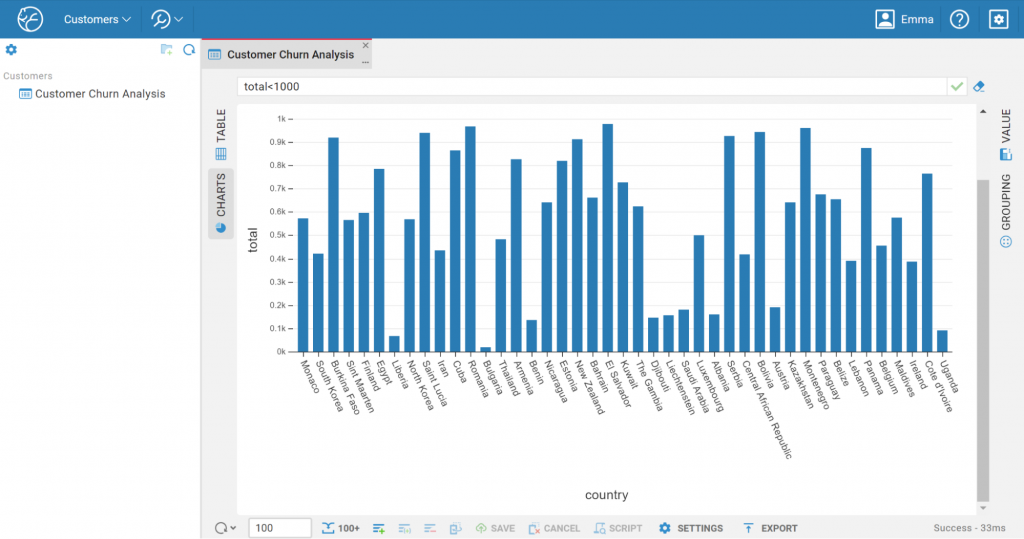
Emma has noticed that the churn rate is particularly high for customer segments in Central America, Northern Europe, and Africa. To investigate further, she filters the data in the Data Editor, adding “total<1000" to the corresponding field to highlight only those who were below a certain amount. The chart updates in real-time, giving Emma a clear visual representation of the filtered data. She has already identified the regions where her company has to work hard, but now she wants to look at both the Bar and Pie Charts simultaneously.
Eager to uncover further insights, Emma leverages the Grouping Panel, experimenting with various customer attributes like age, location, and subscription plan. With each grouping, she can quickly generate new charts, revealing patterns and trends that would be difficult to spot in raw tabular data. She discovers a significant correlation: churn rates are highest in regions plagued by unstable or disrupted supply chains.
Emma’s ability to create and customize charts on the fly empowers her to uncover targeted approaches for customer retention. By visualizing specific customer segments and behaviors, she discovers the need for personalized solutions tailored to different regions. By dynamically adjusting the data displayed in the charts and leveraging CloudBeaver’s advanced metrics through filtering and grouping, she refines her analysis for maximum impact. This iterative approach not only promises to improve customer satisfaction and drive growth, but also demonstrates the tangible value Emma brings to her team.
DBeaver Team Edition’s integrated Datasets and Charts functionality transforms how teams collaborate on data-driven projects. By providing secure, role-based access to specific datasets, administrators empower team members with the precise information they need, reducing the risk of data breaches while streamlining workflows.
Business users, like Marketers or Analysts, can leverage the intuitive charting features to quickly visualize complex data, identify trends, and make informed decisions, regardless of their technical expertise. This democratization of data is invaluable for cross-functional teams working on business intelligence, data analysis, reporting, and ultimately fostering a culture where everyone can contribute to data-driven decision making.
Discover how DBeaver Team Edition can help your team transform data workflows and enhance collaboration across your organization.