Database debugger (PostgreSQL)
Prerequisites for Debugging
To enable interactive debugging of PL/pgSQL procedures on a Postgres server, you need to use the plugin_debugger. The plugin_debugger is a typical interactive debugger delivered as an extension. It requires a shared library preload in Postgres to operate the shared_preload_libraries parameter in the settings. The debugger is developed and maintained by EDB. Its source code is available for examination and improvement.
The debugger provides the required server API for debugging PL/SQL procedures with:
- Breakpoint management;
- Step-by-step tracing;
- Variable acquisition and management.
Installation
PostgreSQL 12 on Ubuntu based distros
If you happen to have a PostgreSQL 12 installed via apt, then the procedure is quite straightforward:
After that, run the following command in the database or databases that you wish to debug functions in:CREATE EXTENSION pldbgapi;
Installation from source code
You can find the source code in this repository. Installation instructions are located in the README file.
Running debugger in the DBeaver interface
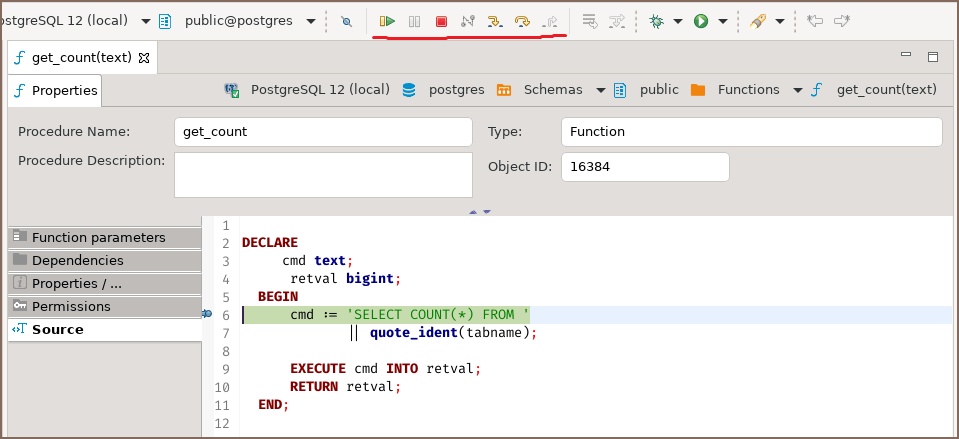
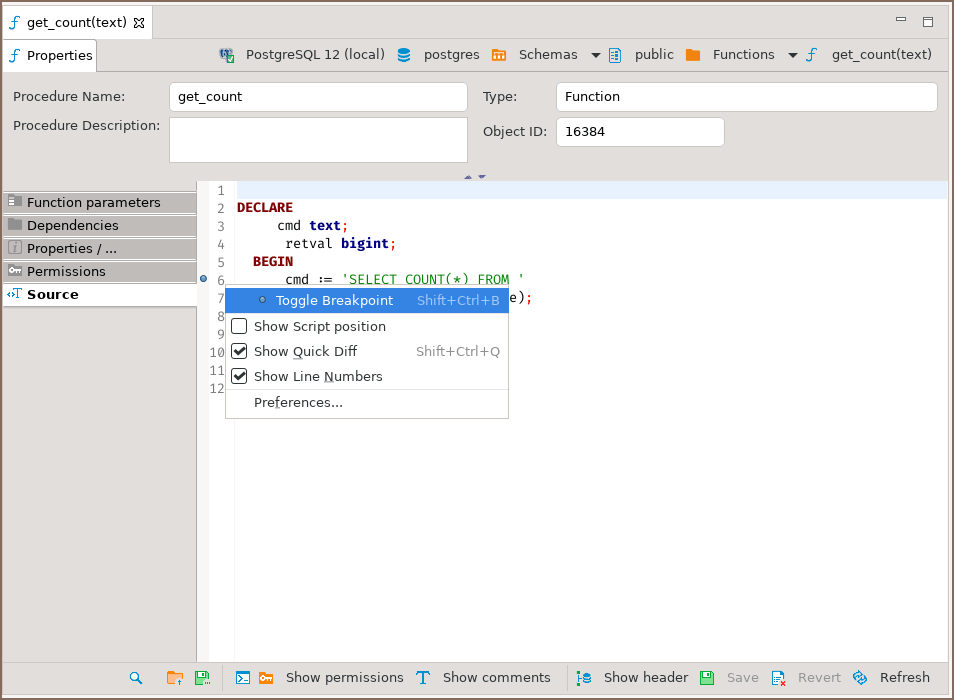
Open the source code of the function you want to debug. To toggle breakpoints,
place the caret on the line you want the function to be stopped at and use a shortcut Shift + Control + B.
Alternatively, you can toggle the breakpoint with your mouse by clicking on a
ruler, as demonstrated in the screenshot below:
NB. You must only toggle the breakpoints when Show header option is not on.
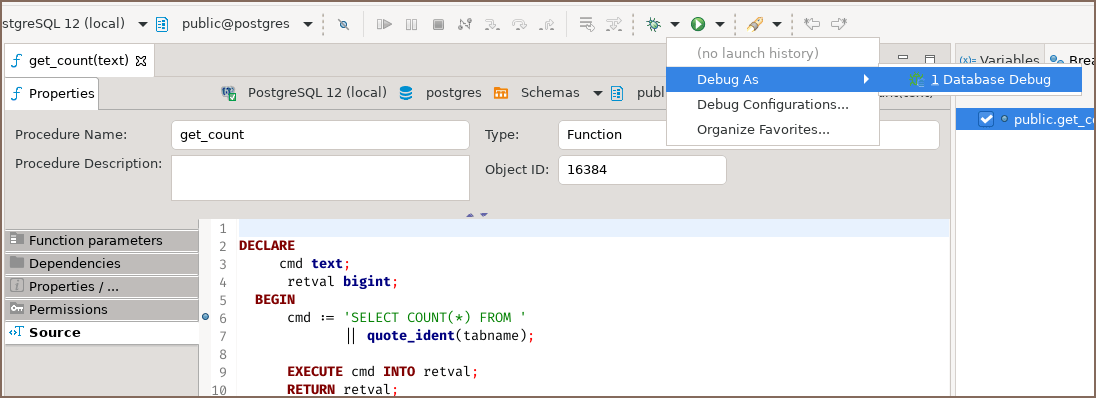
Then you need to set up a debugging configuration. Locate the downward-facing arrow right to the bug icon, click on it, then
Debug As -> Database Debug:
The Edit Configuration dialog opens. Set up input values in the table Function parameters.
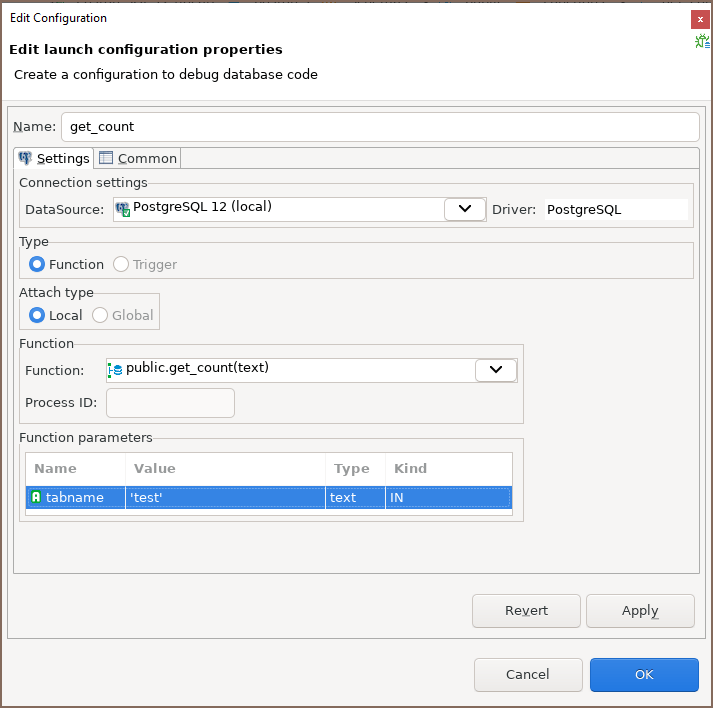
Click on OK button, and you are ready to go!
The usual buttons essential for debugging such as Step Over and Continue are located here: