Query execution plan
This feature is supported for the following data sources:
Note
The Execution plan for databases marked with a star is supported only in Lite, Enterprise and Ultimate editions.
- MySQL
- PostgreSQL
- Microsoft SQL Server

- Oracle
- DB2 LUW
- SAP HANA
- Google Cloud SQL for PostgreSQL

- Google Cloud SQL for SQL Server

- Google Cloud SQL for MySQL

- Couchbase

- Firebird
- Exasol
- HSQLDB
- Vertica

- ClickHouse

- AlloyDB

- Netezza

- OceanBase
- Ocient
Simple plan view
If a database driver supports the visualization of the execution plan, you can see the execution plan of the current query (under cursor) by pressing Ctrl+Shift+E or clicking Explain execution plan on the context menu or in the SQL Editor toolbar:  (Note: toolbar is customizable. See Toolbar Customization)
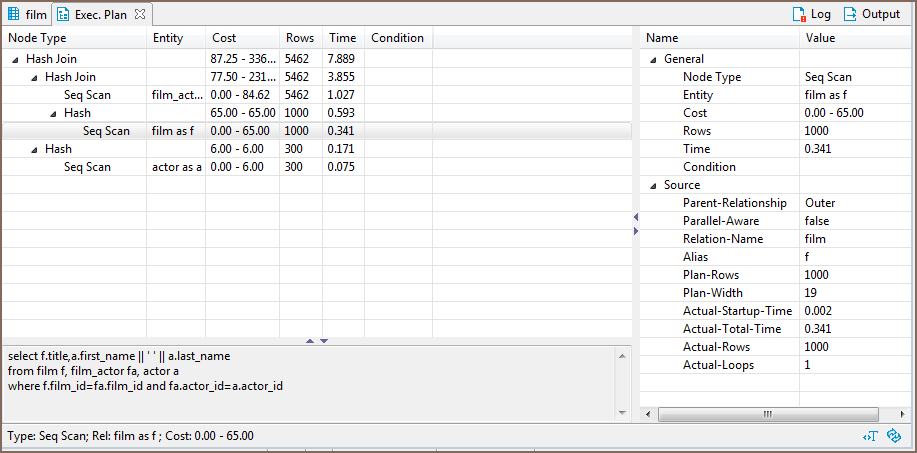
The execution plan command generates a tree of query execution as one of the result tabs and is convenient in estimating if the query/script is quick/optimal enough:

You can click the rows of the execution plan to see their details (statistics) in the panels below and to the right of the plan.
To reevaluate the plan, click the Reevaluate button (![]() ).
To see the source script on which the plan is based, click the View Source button (
).
To see the source script on which the plan is based, click the View Source button ( ).
).
Advanced plan view
Note
This feature is available in Lite, Enterprise, and Ultimate editions only.
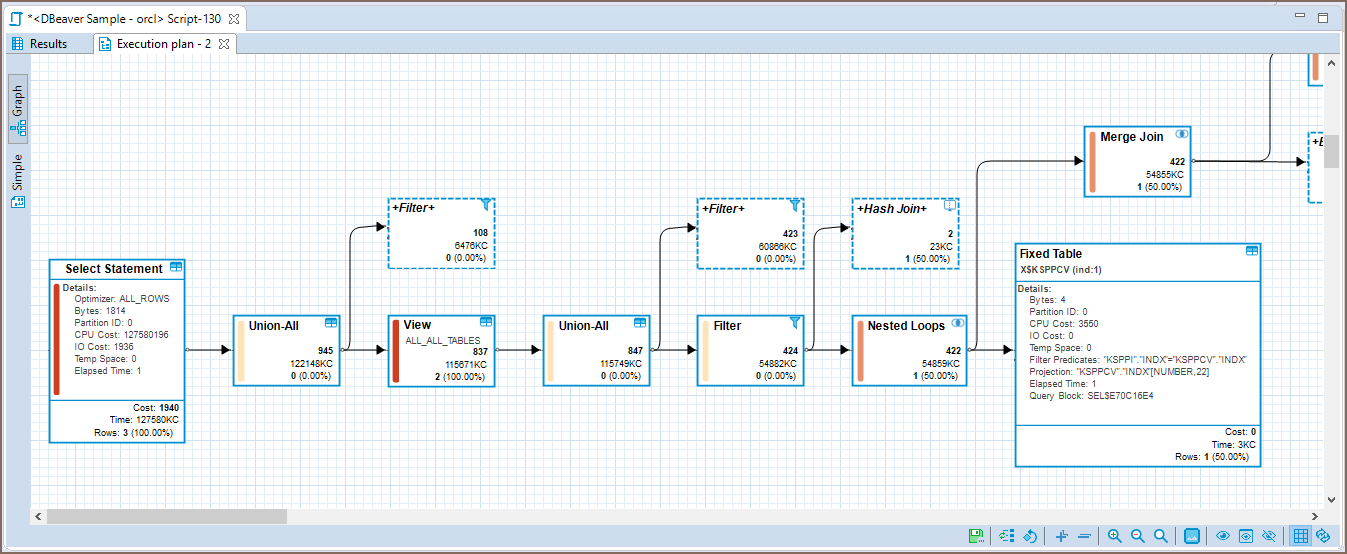
In DBeaver you can use an advanced (graph) visualization of the execution plan. This visualization shows the most expensive (cost-based) plan nodes. You can hide all irrelevant nodes (see node details), use horizontal or vertical plan layouts, export it to an image or save it as JSON to send to a colleague.


