Diagrams
In DBeaver, you can use diagrams to explore database structure, analyze relationships between tables, and navigate complex schemas visually.
DBeaver supports diagrams for existing tables, schemas, and custom visualizations. You can select elements, adjust the layout, and export diagrams for further use. The interface includes:
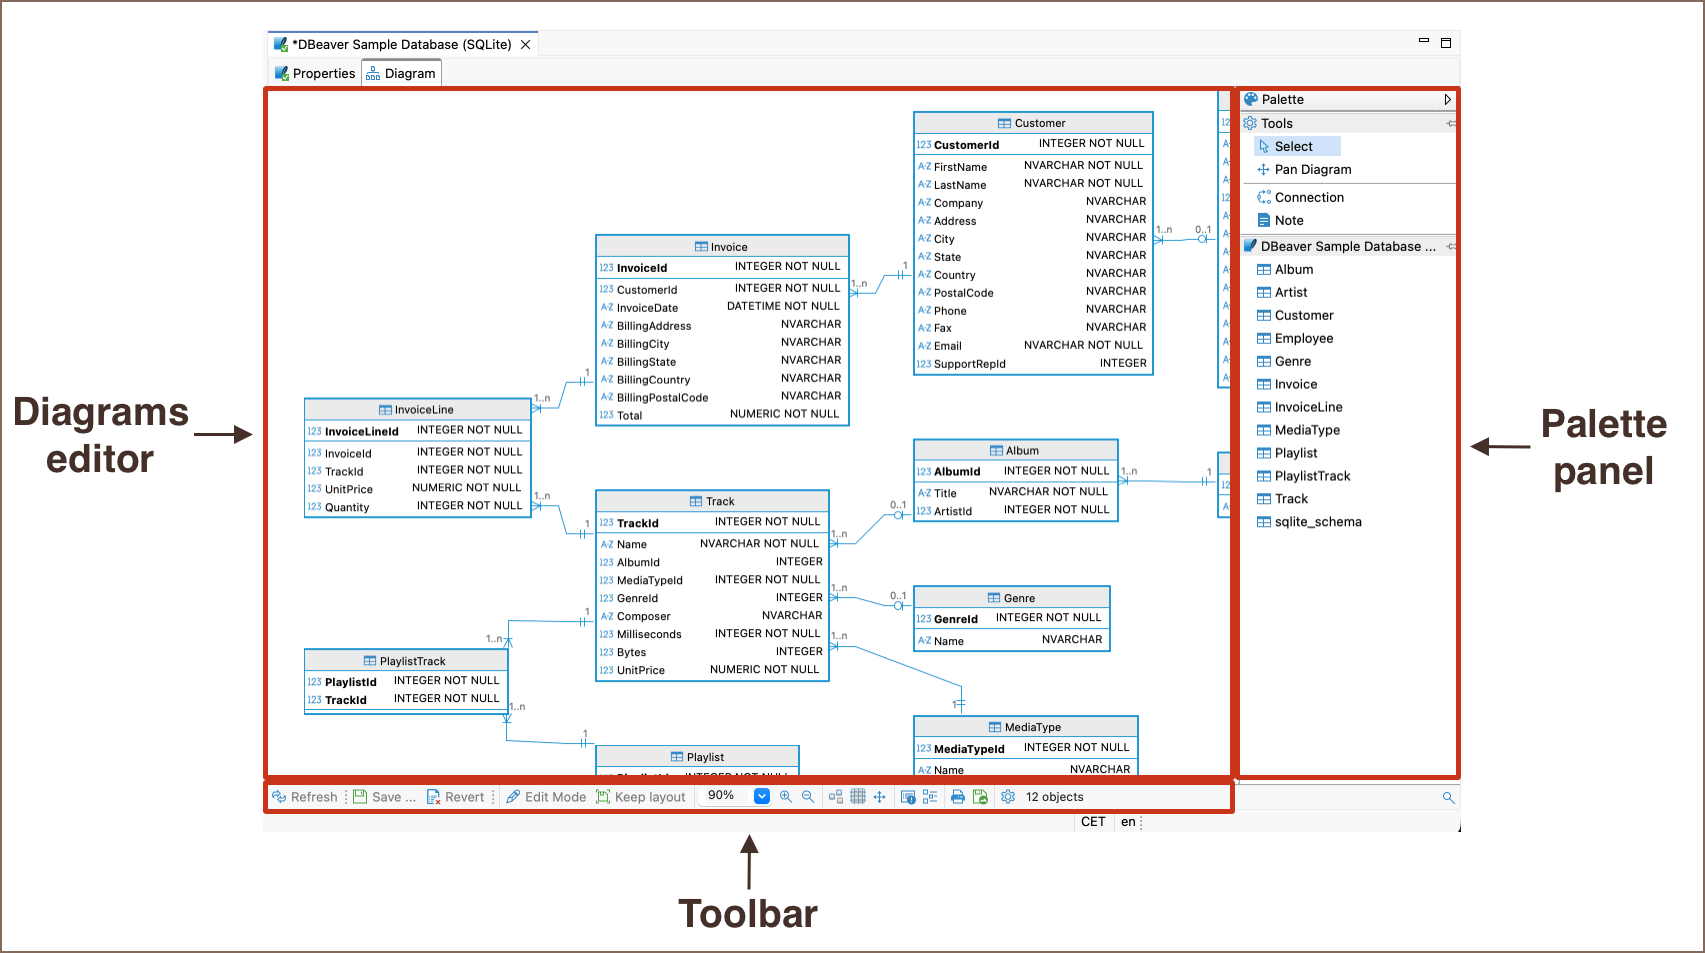
- Diagrams editor: View and rearrange entities and their relationships.
- Palette panel: Access tools for adding connections, notes, and more.
- Toolbar: Manage diagrams with options for saving, exporting, zooming, and configuration.
Open diagram
You can open diagram for individual tables and views, or for full database schemas.
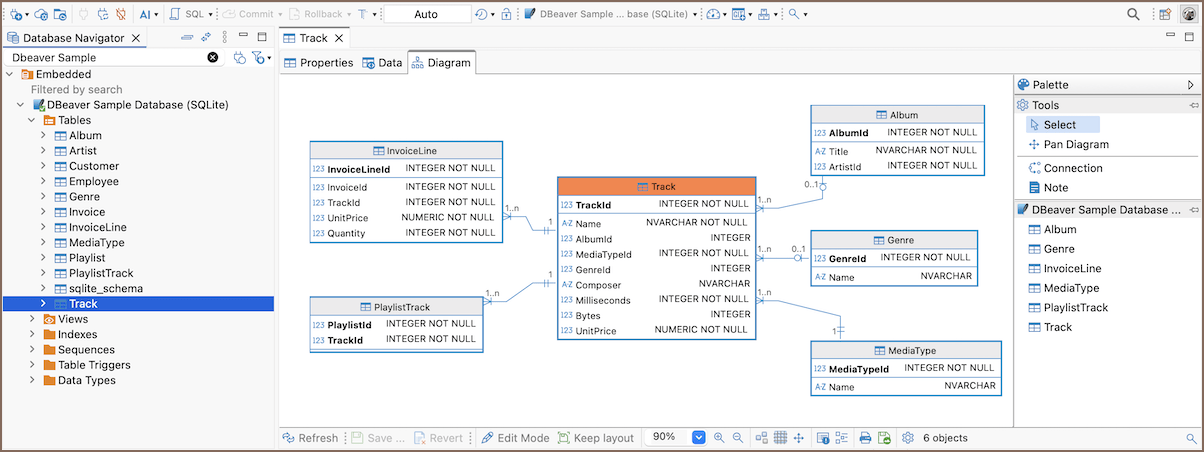
Open a table or view diagram
To view the Diagram for a table or view, double-click the table or view in the Database Navigator and then, in the Database Object Editor, switch to the Diagram tab:
Open a schema diagram
To view the Diagram for a full database schema, double-click the schema name in the Database Navigator or the previous node in the path (usually - Tables):
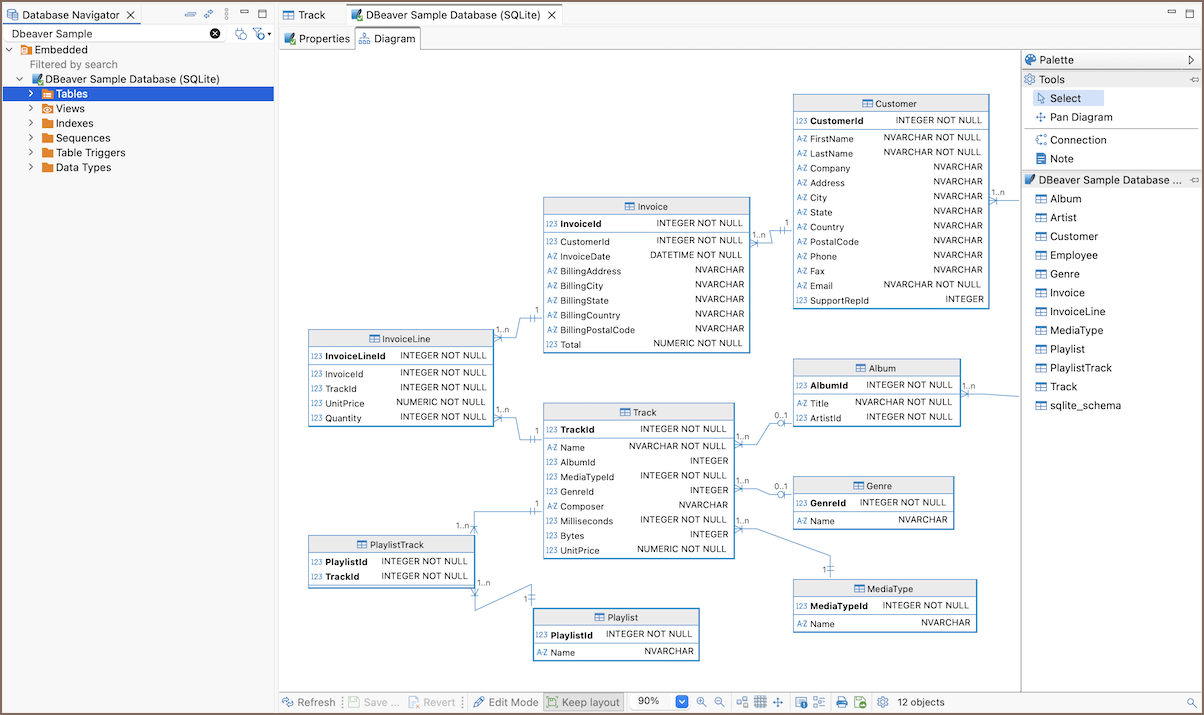
Diagram editor
The Diagram editor lets you explore and work with database structure visually. You can generate SQL, rearrange the layout, change view settings, use different notations and routing types, search within diagrams, and export or print them.
Info
For detailed instructions, see How to use Diagrams.
Edit mode
Diagrams are read-only by default. You can enable Edit mode, and the Diagram editor then switches to schema editing and converts actions such as creating tables, adding columns, or defining foreign keys into an SQL script that you can review and execute to apply changes to the database.
Info
For details, see Edit mode.
Custom diagrams
You can combine tables from different connections in a single workspace using custom diagrams.
Info
For details, see Custom Diagrams.
Palette panel
The Palette panel provides tools for interacting with diagram elements. It includes selection tools, navigation tools, connection creation, notes, and a list of available tables that you can drag onto the diagram.
| Tool | Description |
|---|---|
| Select | Selects objects on the diagram. |
| Pan Diagram | Moves the diagram without selecting elements. |
| Connection | Creates a new connection between tables. |
| Note | Adds a new note element to the diagram. |
Toolbar and contex menu
Use the diagram toolbar to access common actions, and the context menu to control the diagram view.
Toolbar
| Button | Name | Description |
|---|---|---|
 |
Refresh | Reloads the diagram to show external changes in the database schema. |
 |
Save | Saves changes and generates an SQL script for execution. |
 |
Revert | Cancels all unsaved changes made in edit mode. |
 |
Edit Mode | Enables or disables edit mode for creating and modifying database objects. Learn more |
 |
Keep layout | Save diagram layout locally. Otherwise entities layout will be reverted on editor reopen. |
 |
Zoom level dropdown | Sets the zoom level for the diagram (e.g., 100%). |
  |
Zoom In / Zoom Out | Adjusts the diagram scale. |
 |
Auto-arrange layout | Automatically rearranges tables into a compact and readable layout. |
 |
Toggle Grid | Shows or hides the diagram grid. |
 |
Toggle Hand Tool | Enables pan mode to move the diagram view. |
 |
Properties | Selected object properties. |
 |
Outline | Opens a diagram overview mini-map for easier navigation. |
 |
Prints the current diagram. | |
 |
Save diagram in external format | Exports the diagram as SVG  , , PNG, GIF, BMP, or GraphML. |
| Configuration | Opens diagram preferences. | |
 |
Search | Opens the search field and highlights matching tables and columns on the diagram. |
Context menu
Note
Available actions in the context menu depend on what you select in the diagram:
- the diagram canvas
- a table
- a column
| Item | Description |
|---|---|
| Create | Opens a submenu for creating new objects in a diagram (Table, Column, Foreign Key, Index). |
| Create New Column | Creates a new column in the selected table. |
| New Index from Selection | Creates a new index based on the selected column. |
| New Constraint from Selection | Creates a new constraint using the selected colum. |
| Rename | Renames the selected column. |
| Edit Mode | Enables or disables edit mode for creating and modifying database objects. Learn more |
| Bring to front | Moves the selected element above others. |
| Send to back | Moves the selected element behind others. |
| Set color | Assigns a custom color to the selected object. |
| Remove color | Removes the custom color from the selected object. |
| Customize… | Opens object-specific customization options. |
| View Styles | Opens display style options. Learn more |
| Show Attributes | Controls attribute visibility. Learn more |
| Notation | Switches relationship notation. |
| Router | Switches routing type. |
| Arrange Diagram | Automatically rearranges tables into a compact and readable layout. |
| Toggle Grid | Shows or hides the diagram grid. |
| Keep layout | Saves the diagram layout locally. Otherwise, the layout is reset when reopening the editor. |
| Copy | Copies the selected diagram object to the clipboard. |
| Delete | Removes the selected element from the diagram. |
| Save diagram as… | Exports the diagram as SVG , PNG, GIF, BMP, or GraphML. |
| View Diagram | Opens a new diagram focused on the selected object and its related objects. |
| Tools | Opens additional tools available for the selected object. |
| Generate SQL | Generates SQL statements for the selected tables or relationships. Learn more |
| Undo | Reverts the last action. |
| Redo | Re-applies the reverted action. |
| Select All | Selects all diagram elements. |
Diagram preferences
To customize how diagrams are displayed using global Diagram preferences, navigate to Window -> Preferences -> Editors -> Diagram Editor.
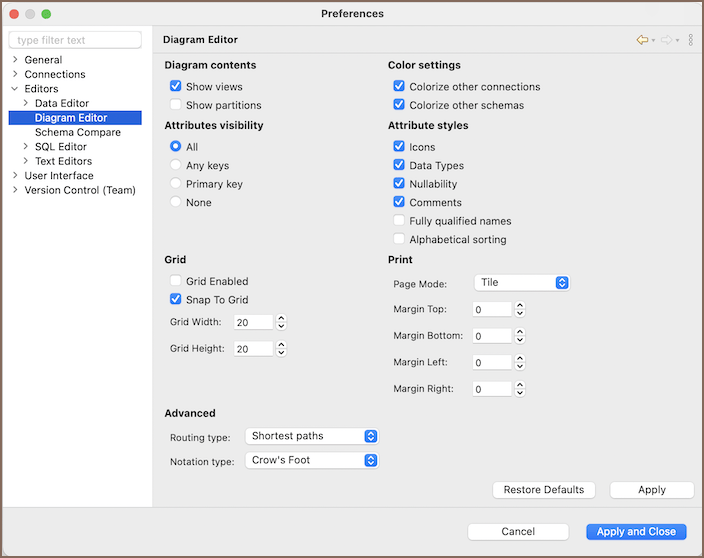
Diagram contents
| Option | Description |
|---|---|
| Show views | Display database views on the diagram. |
| Show partitions | Display table partitions on the diagram. |
Color settings
| Option | Description |
|---|---|
| Colorize other connections | Apply color highlighting to non-selected connections. |
| Colorize other schemas | Colorize tables that belong to other schemas. |
Attributes visibility
| Option | Description |
|---|---|
| All | Show all attributes in tables. |
| Any keys | Show only primary and foreign keys. |
| Primary key | Show only primary keys. |
| None | Hide all attributes. |
Attribute styles
| Option | Description |
|---|---|
| Icons | Show attribute icons. |
| Data Types | Show attribute data types. |
| Nullability | Show NULL/NOT NULL markers. |
| Comments | Show column comments. |
| Fully qualified names | Show full table names with schema. |
| Alphabetical sorting | Sort attributes alphabetically. |
Grid
| Option | Description |
|---|---|
| Grid Enabled | Display grid lines on the diagram. |
| Snap To Grid | Snap elements to the grid when moving. |
| Grid Width / Grid Height | Set grid cell size. |
Print
| Option | Description |
|---|---|
| Page Mode | Select a layout mode for printing (e.g., Tile). |
| Margin Top / Bottom / Left / Right | Set print margins in pixels. |
Advanced
| Option | Description |
|---|---|
| Routing type | Configure connection routing (Shortest paths, etc.). Learn more |
| Notation type | Choose diagram notation (Crow’s Foot, IDEF1X, Bachman, etc.). Learn more |