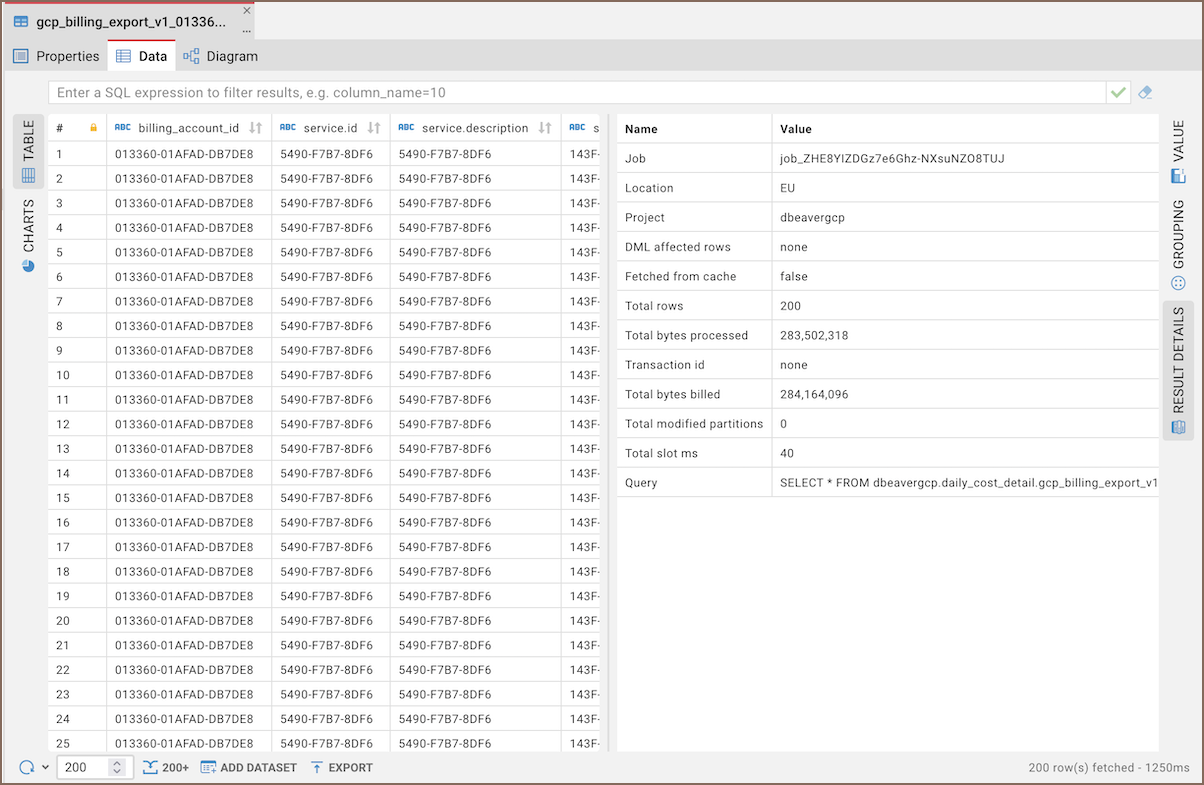
Result details Panel
The Result details panel provides you with information about the execution of a SELECT query. To open the panel, click
the Result Details button on the right-hand side of the Data tab.
Note
This panel is specific to BigQuery and provides details that help in monitoring query costs.

Metrics
Result details panel includes the following metrics:
| Name | Description |
|---|---|
| Job | The unique identifier of the job. |
| Location | The regional location of the data you have queried. |
| Project | The project within which the query was executed. |
| DML affected rows | The number of rows affected by a Data Manipulation Language (DML) statement. |
| Fetched from cache | Indicates if the results were retrieved from the cache. true means no additional costs are incurred for data processing. |
| Total rows | The number of rows returned by the query. |
| Total bytes processed | The amount of data processed by the query. This is important for cost calculations as costs are incurred based on the amount of data processed. If the Total bytes processed is zero, it indicates that the query results were served from the cache, which does not incur costs. |
| Transaction id | The identifier for the transaction within which the query was executed, if applicable. |
| Total bytes billed | The total bytes billed for the query, which might be different from the bytes processed if discounts or caps are applied. |
| Total modified partitions | The total number of partitions that were modified as a result of the query execution. |
| Total slot ms | The total number of slot milliseconds consumed by the query. |
| Query | The SQL query statement that was executed. |

