Query execution plan
View query execution plans to understand how a database executes SQL statements and identify expensive operations.
The execution plan view helps you:
- Identify expensive operations: Pinpoint which parts of your query consume the most resources.
- Analyze execution flow: Trace the sequence of database operations from start to finish.
- Find bottlenecks: Locate performance issues in joins, scans, and sorting operations.
- Understand relationships: Visualize how data moves between different query steps.
Supported databases
Note
Execution plans for databases marked with a star are available only in Lite, Enterprise, and Ultimate editions.
- MySQL
- PostgreSQL
- Microsoft SQL Server

- Oracle
- DB2 LUW
- SAP HANA
- Google Cloud SQL for PostgreSQL
- Google Cloud SQL for SQL Server
- Google Cloud SQL for MySQL
- Couchbase
- Firebird
- Exasol
- HSQLDB
- Vertica
- ClickHouse
- AlloyDB
- Netezza
- OceanBase
- Ocient
Generate an execution plan
- Open the SQL Editor.
- Write a query.
-
Click Explain Execution Plan (
 ) in the editor toolbar.
Note
The toolbar is customizable. For further information, refer to Toolbar Customization article.
You can configure additional plan options before generating the execution plan.
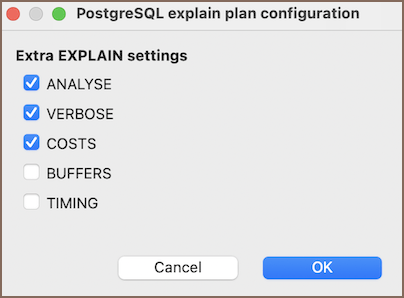
The available options depend on the database and driver.
Tip
Some databases support additional EXPLAIN parameters, such as
ANALYSE,VERBOSE,COSTS,BUFFERS, orTIMING. -
Click OK to generate the plan.
Graph plan view
The Graph plan view displays the execution plan as a graph of connected nodes.
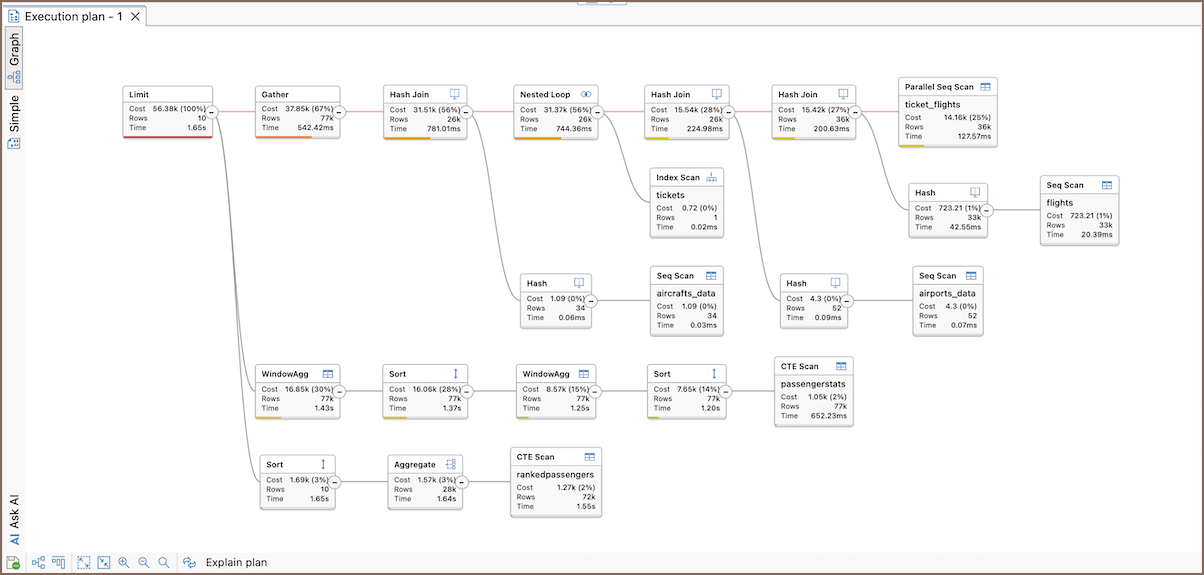
Each node represents a database operation. Connections between nodes show the execution flow and relationships between query steps. Learn more on how to analyze the graph.
Select a node to view detailed execution information.
Tip
Some metrics are available only when specific EXPLAIN options are enabled during plan generation. If required metrics
are missing, reevaluate (![]() ) the execution plan with additional EXPLAIN options
enabled.
) the execution plan with additional EXPLAIN options
enabled.
Graph toolbar
| Button | Action | Description |
|---|---|---|
 |
Ask AI | Explains the execution plan and provides optimization tips using AI. For more information, see AI Assistant. |
 |
Save plan | Saves the execution plan. |
 |
Toggle direction | Switches the graph layout between horizontal and vertical modes. |
 |
Toggle layout | Switches between compact and tree graph layouts. |
 |
Expand all | Expands all nodes in the graph. |
 |
Collapse all except heavy route | Collapse nodes except the heaviest execution path. |
  |
Zoom In / Zoom Out | Zooms in or out of the graph. |
 |
Fit to screen | Fits the entire graph into the available space. |
| Reevaluate | Reruns the execution plan using the current query and options. |
Analyze the graph
The graph highlights performance issues using the following visual cues:
- Status bars: Colored bars at the bottom of nodes provide a quick visual reference for the relative cost of individual operations. Nodes with high execution costs are highlighted in brighter colors, such as red or orange.
- The heavy route: DBeaver automatically identifies and colors the most expensive execution path in red to show the primary bottleneck.
- Node metrics: Each node displays key estimated values, including Cost, Rows, and percentage of total plan cost.
Understanding the heavy route
The heavy route is the slowest part of your query. If a query is slow, start your optimization here.
Nodes usually turn red for three reasons:
-
The database scans the entire table because a suitable index is missing or cannot be used.
Tip
If you see a Full Table Scan, Seq Scan, or Table Access (Full) on a large table, try adding an index to the columns used in your
WHEREclause. -
You are processing or sorting millions of rows at once.
- Tables are linked inefficiently because of missing keys.
Simple plan view
The simple plan view displays the execution plan as a table.
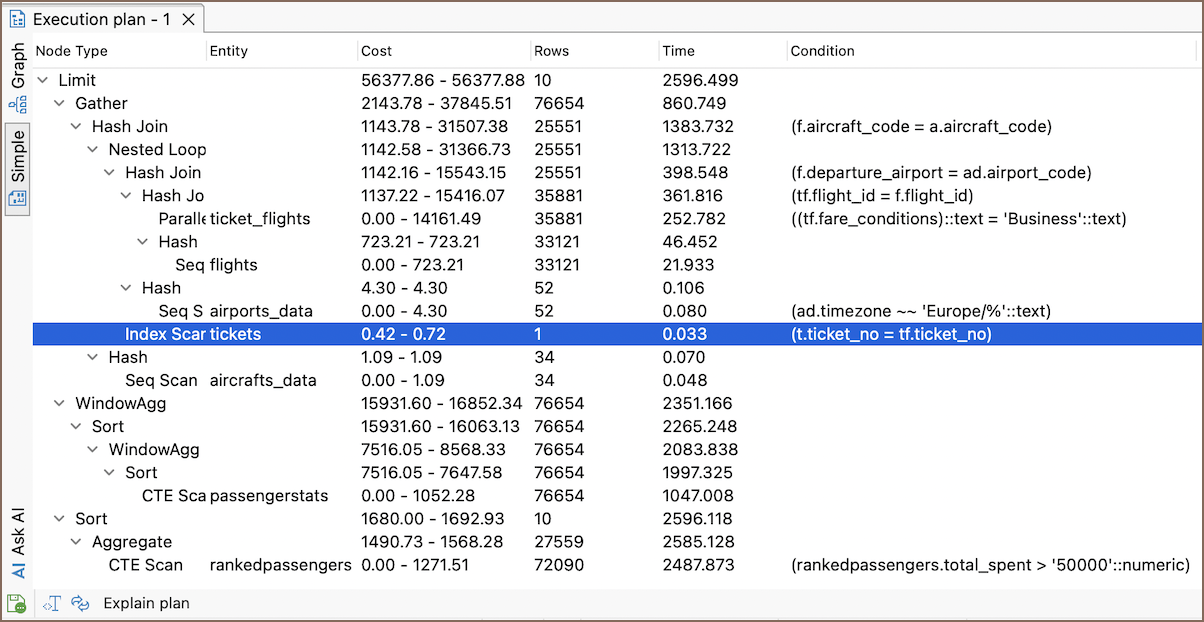
Select a row to view detailed execution information.
Tip
Some metrics are available only when specific EXPLAIN options are enabled during plan generation. If required metrics
are missing, reevaluate (![]() ) the execution plan with additional EXPLAIN options
enabled.
) the execution plan with additional EXPLAIN options
enabled.
Simple plan view toolbar
| Button | Action | Description |
|---|---|---|
| Reevaluate the plan | Reruns the execution plan using the current query and options. | |
 |
Open the source query | Opens the SQL script associated with the execution plan. |
Detailed execution information
Select a node to view detailed execution information.
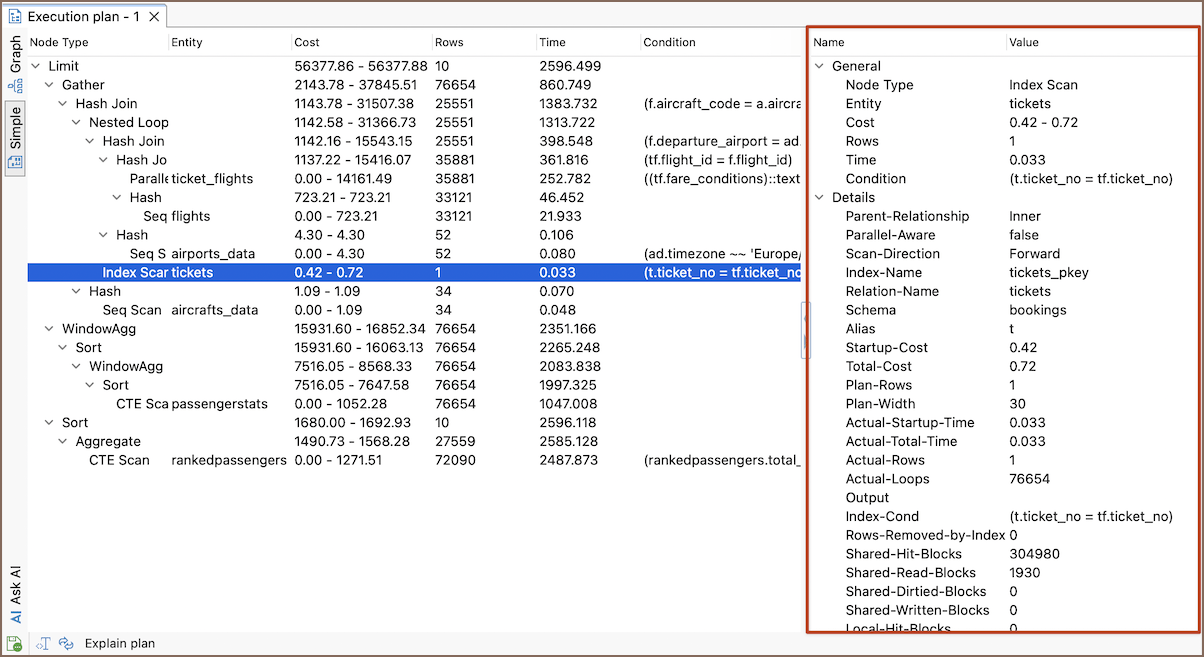
Execution plan data is provided directly by the database engine. The meaning of specific operations, metrics, and attributes depends on the database system you are using. For detailed information about execution plan operations and metrics, see the documentation for your database system.